Overview of Copilot for Data Science and Data Engineering (preview)
Important
This feature is in preview.
Copilot for Data Science and Data Engineering is an AI assistant that helps analyze and visualize data. It works with Lakehouse tables and files, Power BI Datasets, and pandas/spark/fabric dataframes, providing answers and code snippets directly in the notebook. The most effective way of using Copilot is to add your data as a dataframe. You can ask your questions in the chat panel, and the AI provides responses or code to copy into your notebook. It understands your data's schema and metadata, and if data is loaded into a dataframe, it has awareness of the data inside of the data frame as well. You can ask Copilot to provide insights on data, create code for visualizations, or provide code for data transformations, and it recognizes file names for easy reference. Copilot streamlines data analysis by eliminating complex coding.
Note
- Your administrator needs to enable the tenant switch before you start using Copilot. See the article Copilot tenant settings for details.
- Your F64 or P1 capacity needs to be in one of the regions listed in this article, Fabric region availability.
- If your tenant or capacity is outside the US or France, Copilot is disabled by default unless your Fabric tenant admin enables the Data sent to Azure OpenAI can be processed outside your tenant's geographic region, compliance boundary, or national cloud instance tenant setting in the Fabric Admin portal.
- Copilot in Microsoft Fabric isn't supported on trial SKUs. Only paid SKUs (F64 or higher, or P1 or higher) are supported.
- Copilot in Fabric is currently rolling out in public preview and is expected to be available for all customers by end of March 2024.
- See the article Overview of Copilot in Fabric and Power BI for more information.
Introduction to Copilot for Data Science and Data Engineering for Fabric Data Science
With Copilot for Data Science and Data Engineering, you can chat with an AI assistant that can help you handle your data analysis and visualization tasks. You can ask the Copilot questions about lakehouse tables, Power BI Datasets, or Pandas/Spark dataframes inside notebooks. Copilot answers in natural language or code snippets. Copilot can also generate data-specific code for you, depending on the task. For example, Copilot for Data Science and Data Engineering can generate code for:
- Chart creation
- Filtering data
- Applying transformations
- Machine learning models
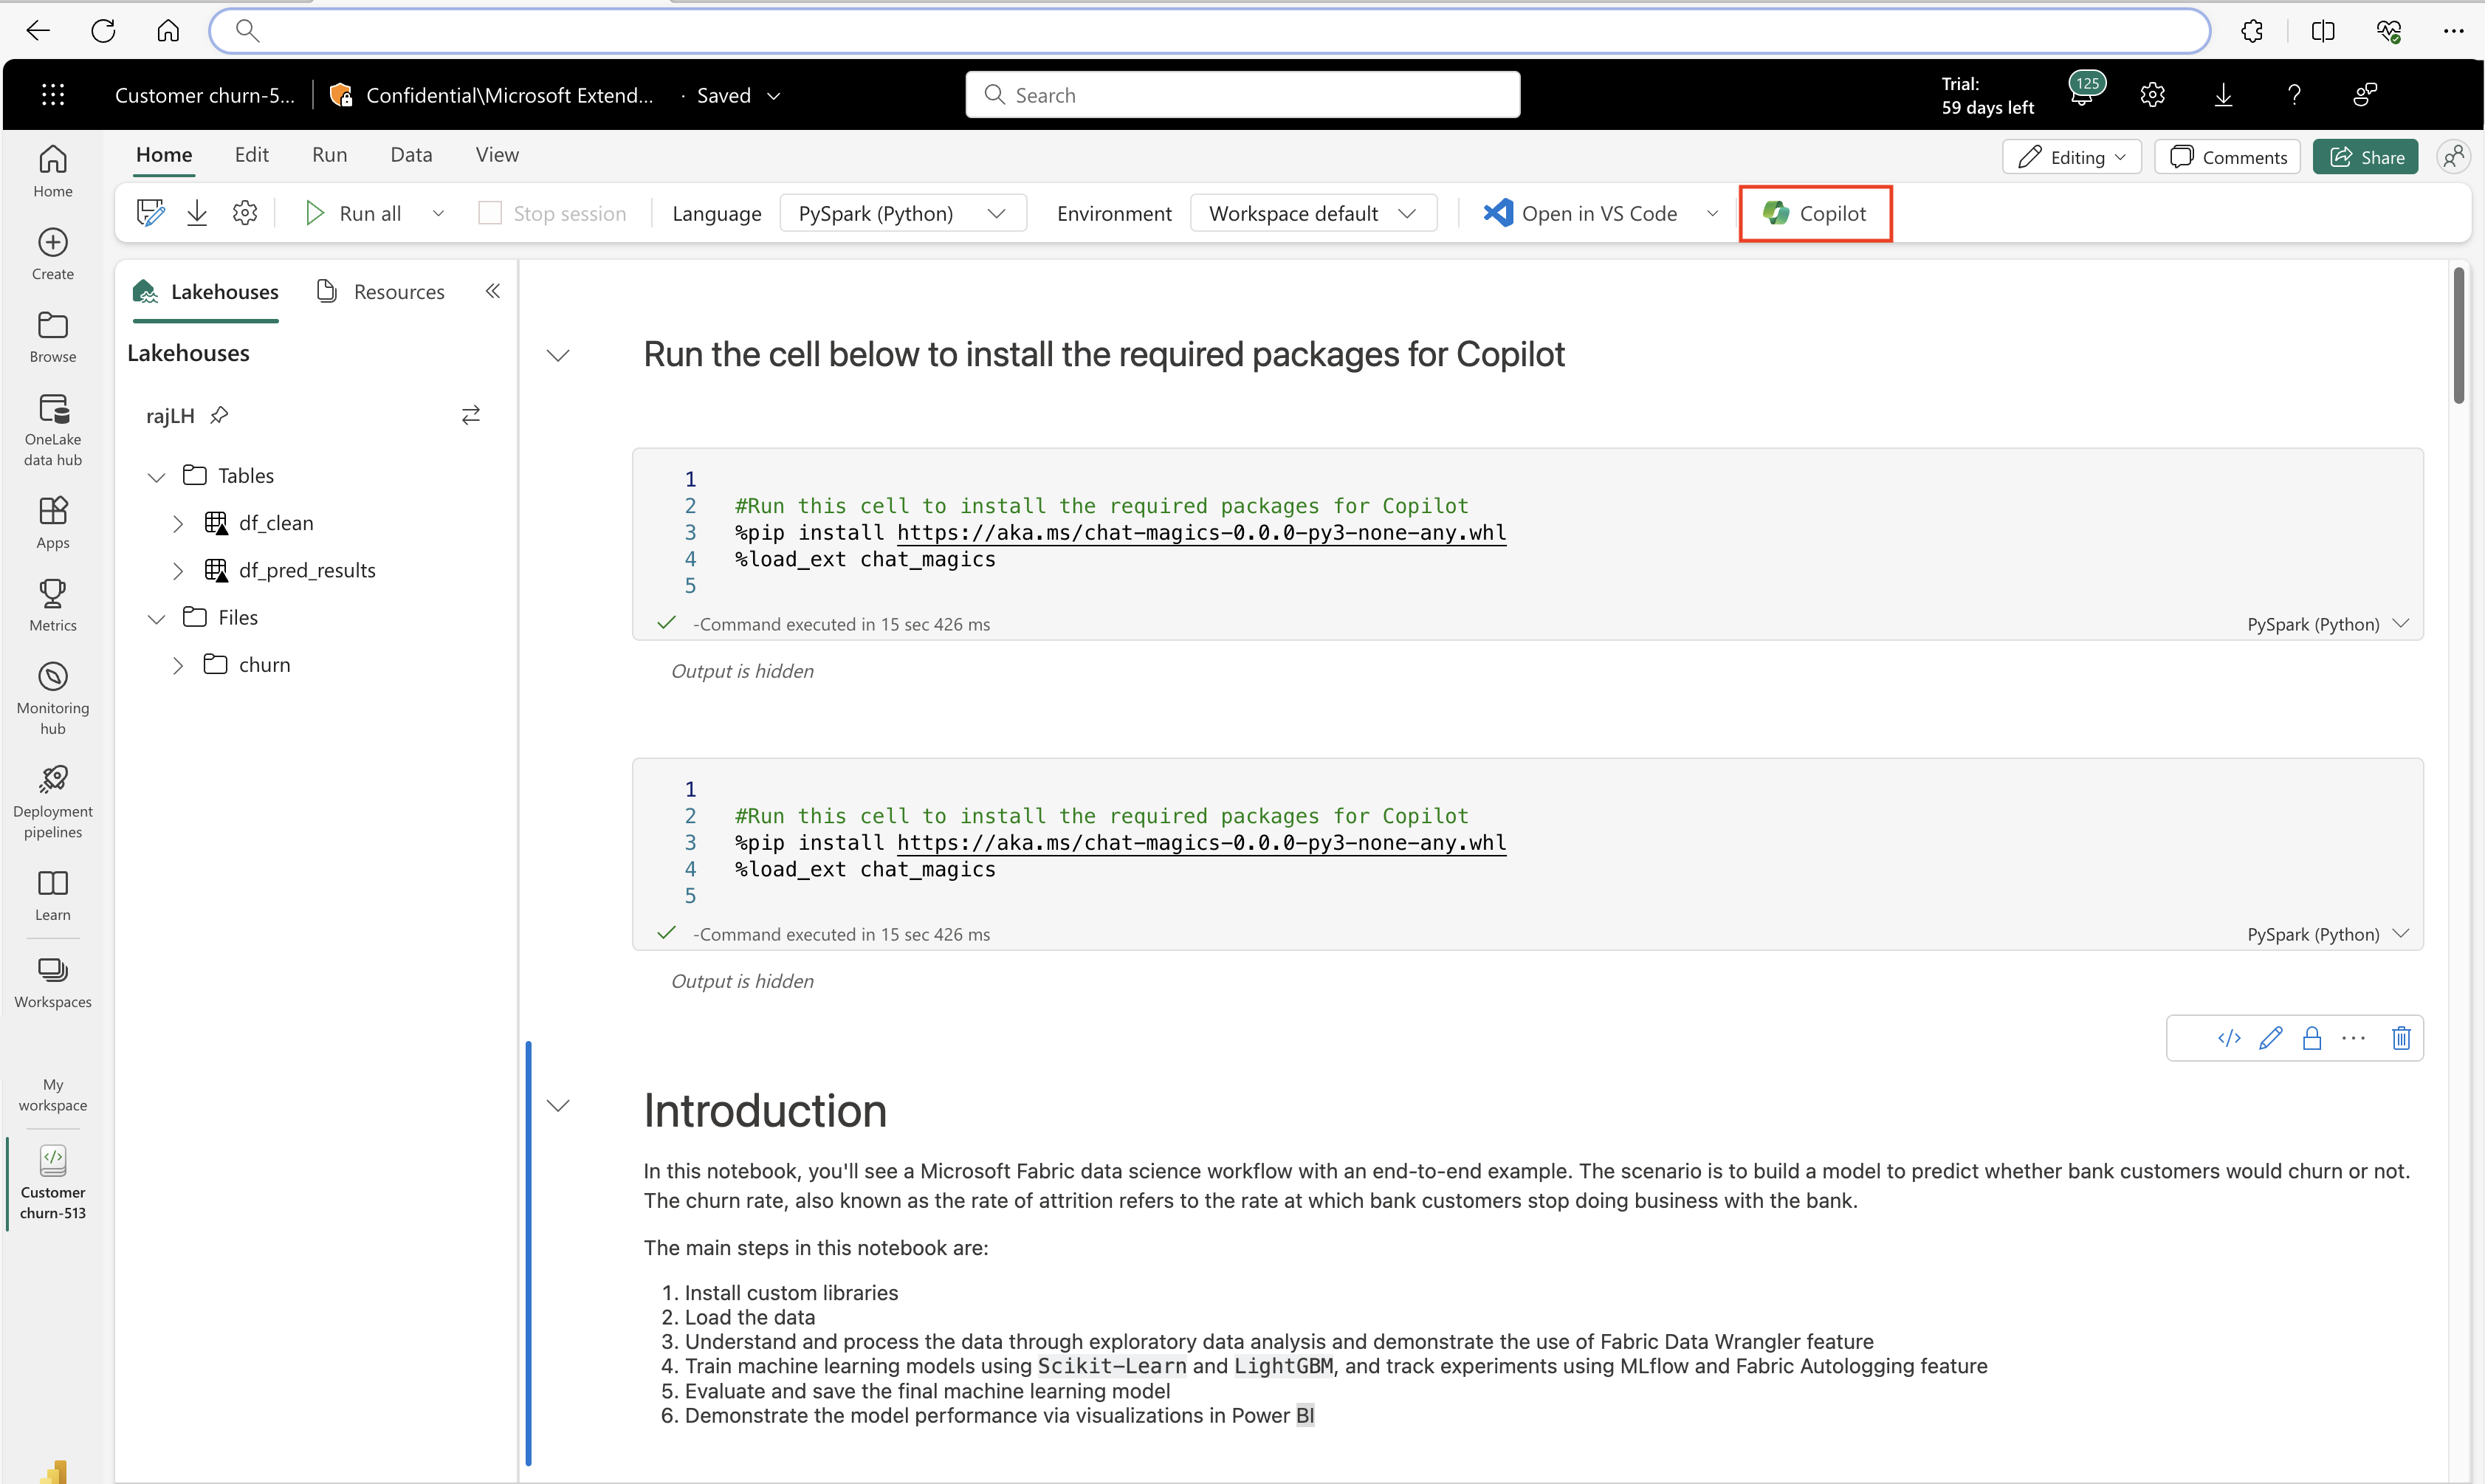
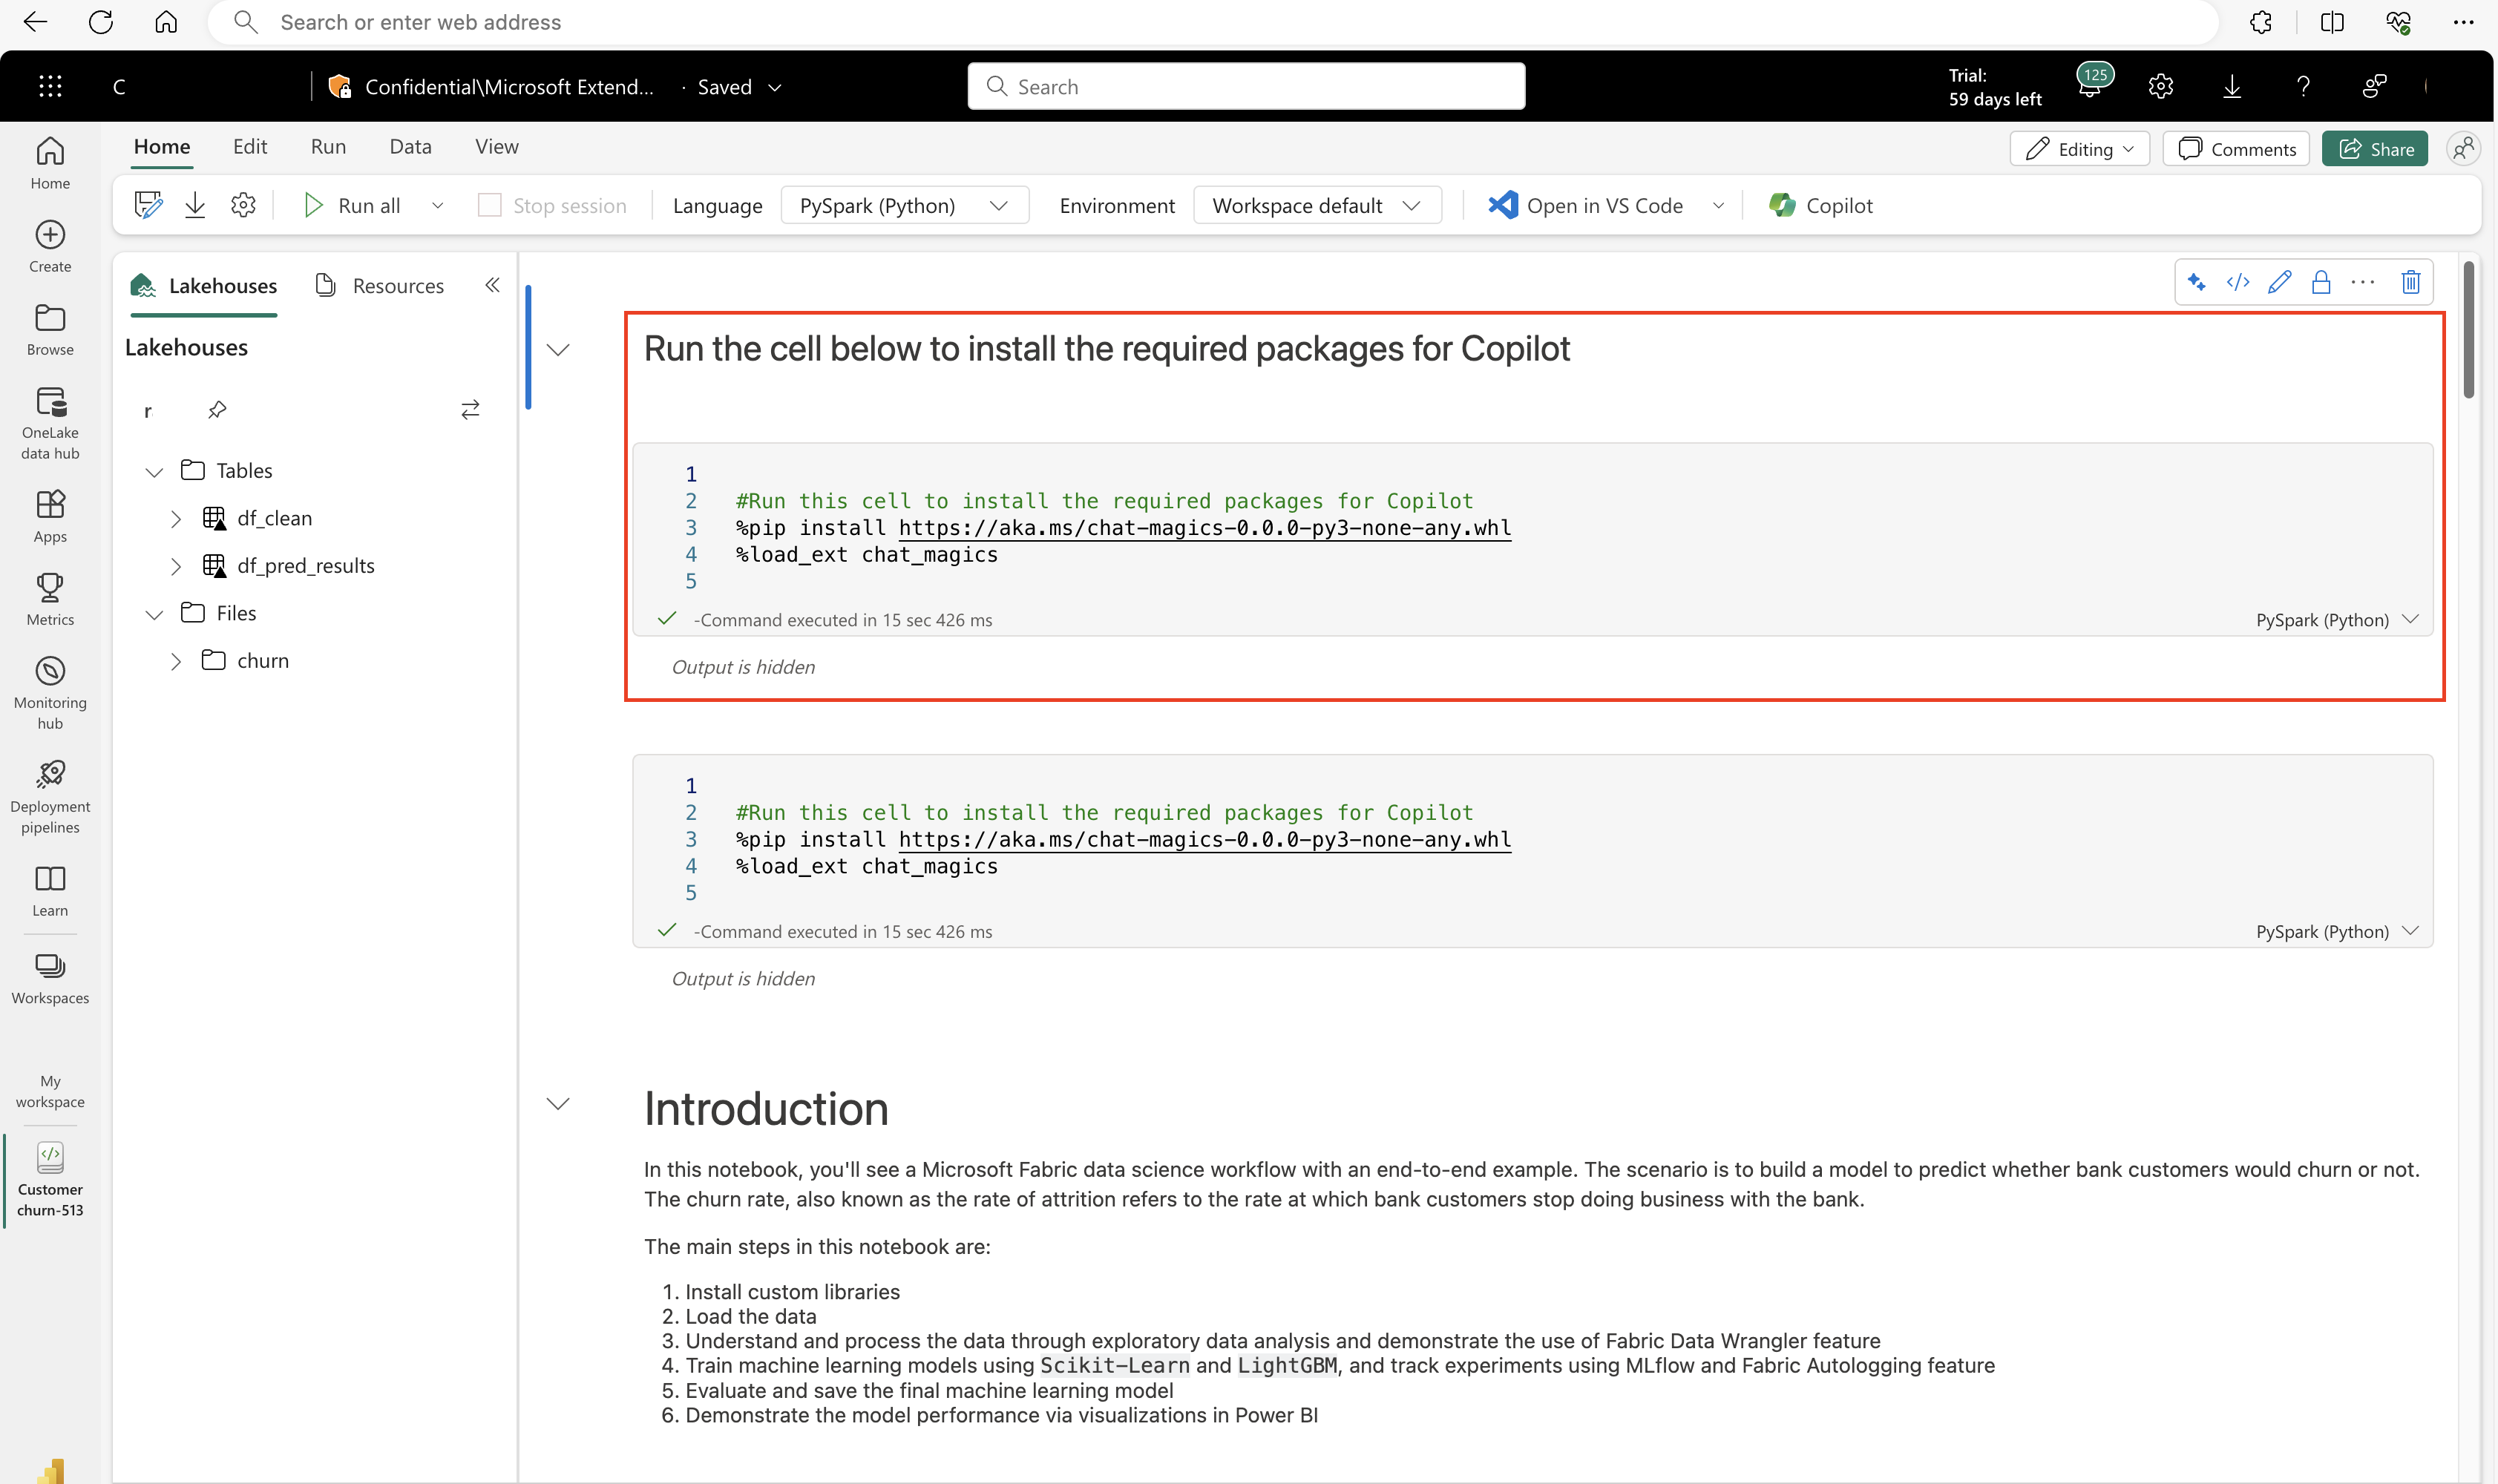
First select the Copilot icon in the notebooks ribbon. The Copilot chat panel opens, and a new cell appears at the top of your notebook. This cell must run each time a Spark session loads in a Fabric notebook. Otherwise, the Copilot experience won't properly operate. We are in the process of evaluating other mechanisms for handling this required initialization in future releases.
Run the cell at the top of the notebook, with this code:
#Run this cell to install the required packages for Copilot
%load_ext dscopilot_installer
%activate_dscopilot
After the cell successfully executes, you can use Copilot. You must rerun the cell at the top of the notebook each time your session in the notebook closes.
To maximize Copilot effectiveness, load a table or dataset as a dataframe in your notebook. This way, the AI can access the data and understand its structure and content. Then, start chatting with the AI. Select the chat icon in the notebook toolbar, and type your question or request in the chat panel. For example, you can ask:
- "What is the average age of customers in this dataset?"
- "Show me a bar chart of sales by region"
And more. Copilot responds with the answer or the code, which you can copy and paste it your notebook. Copilot for Data Science and Data Engineering is a convenient, interactive way to explore and analyze your data.
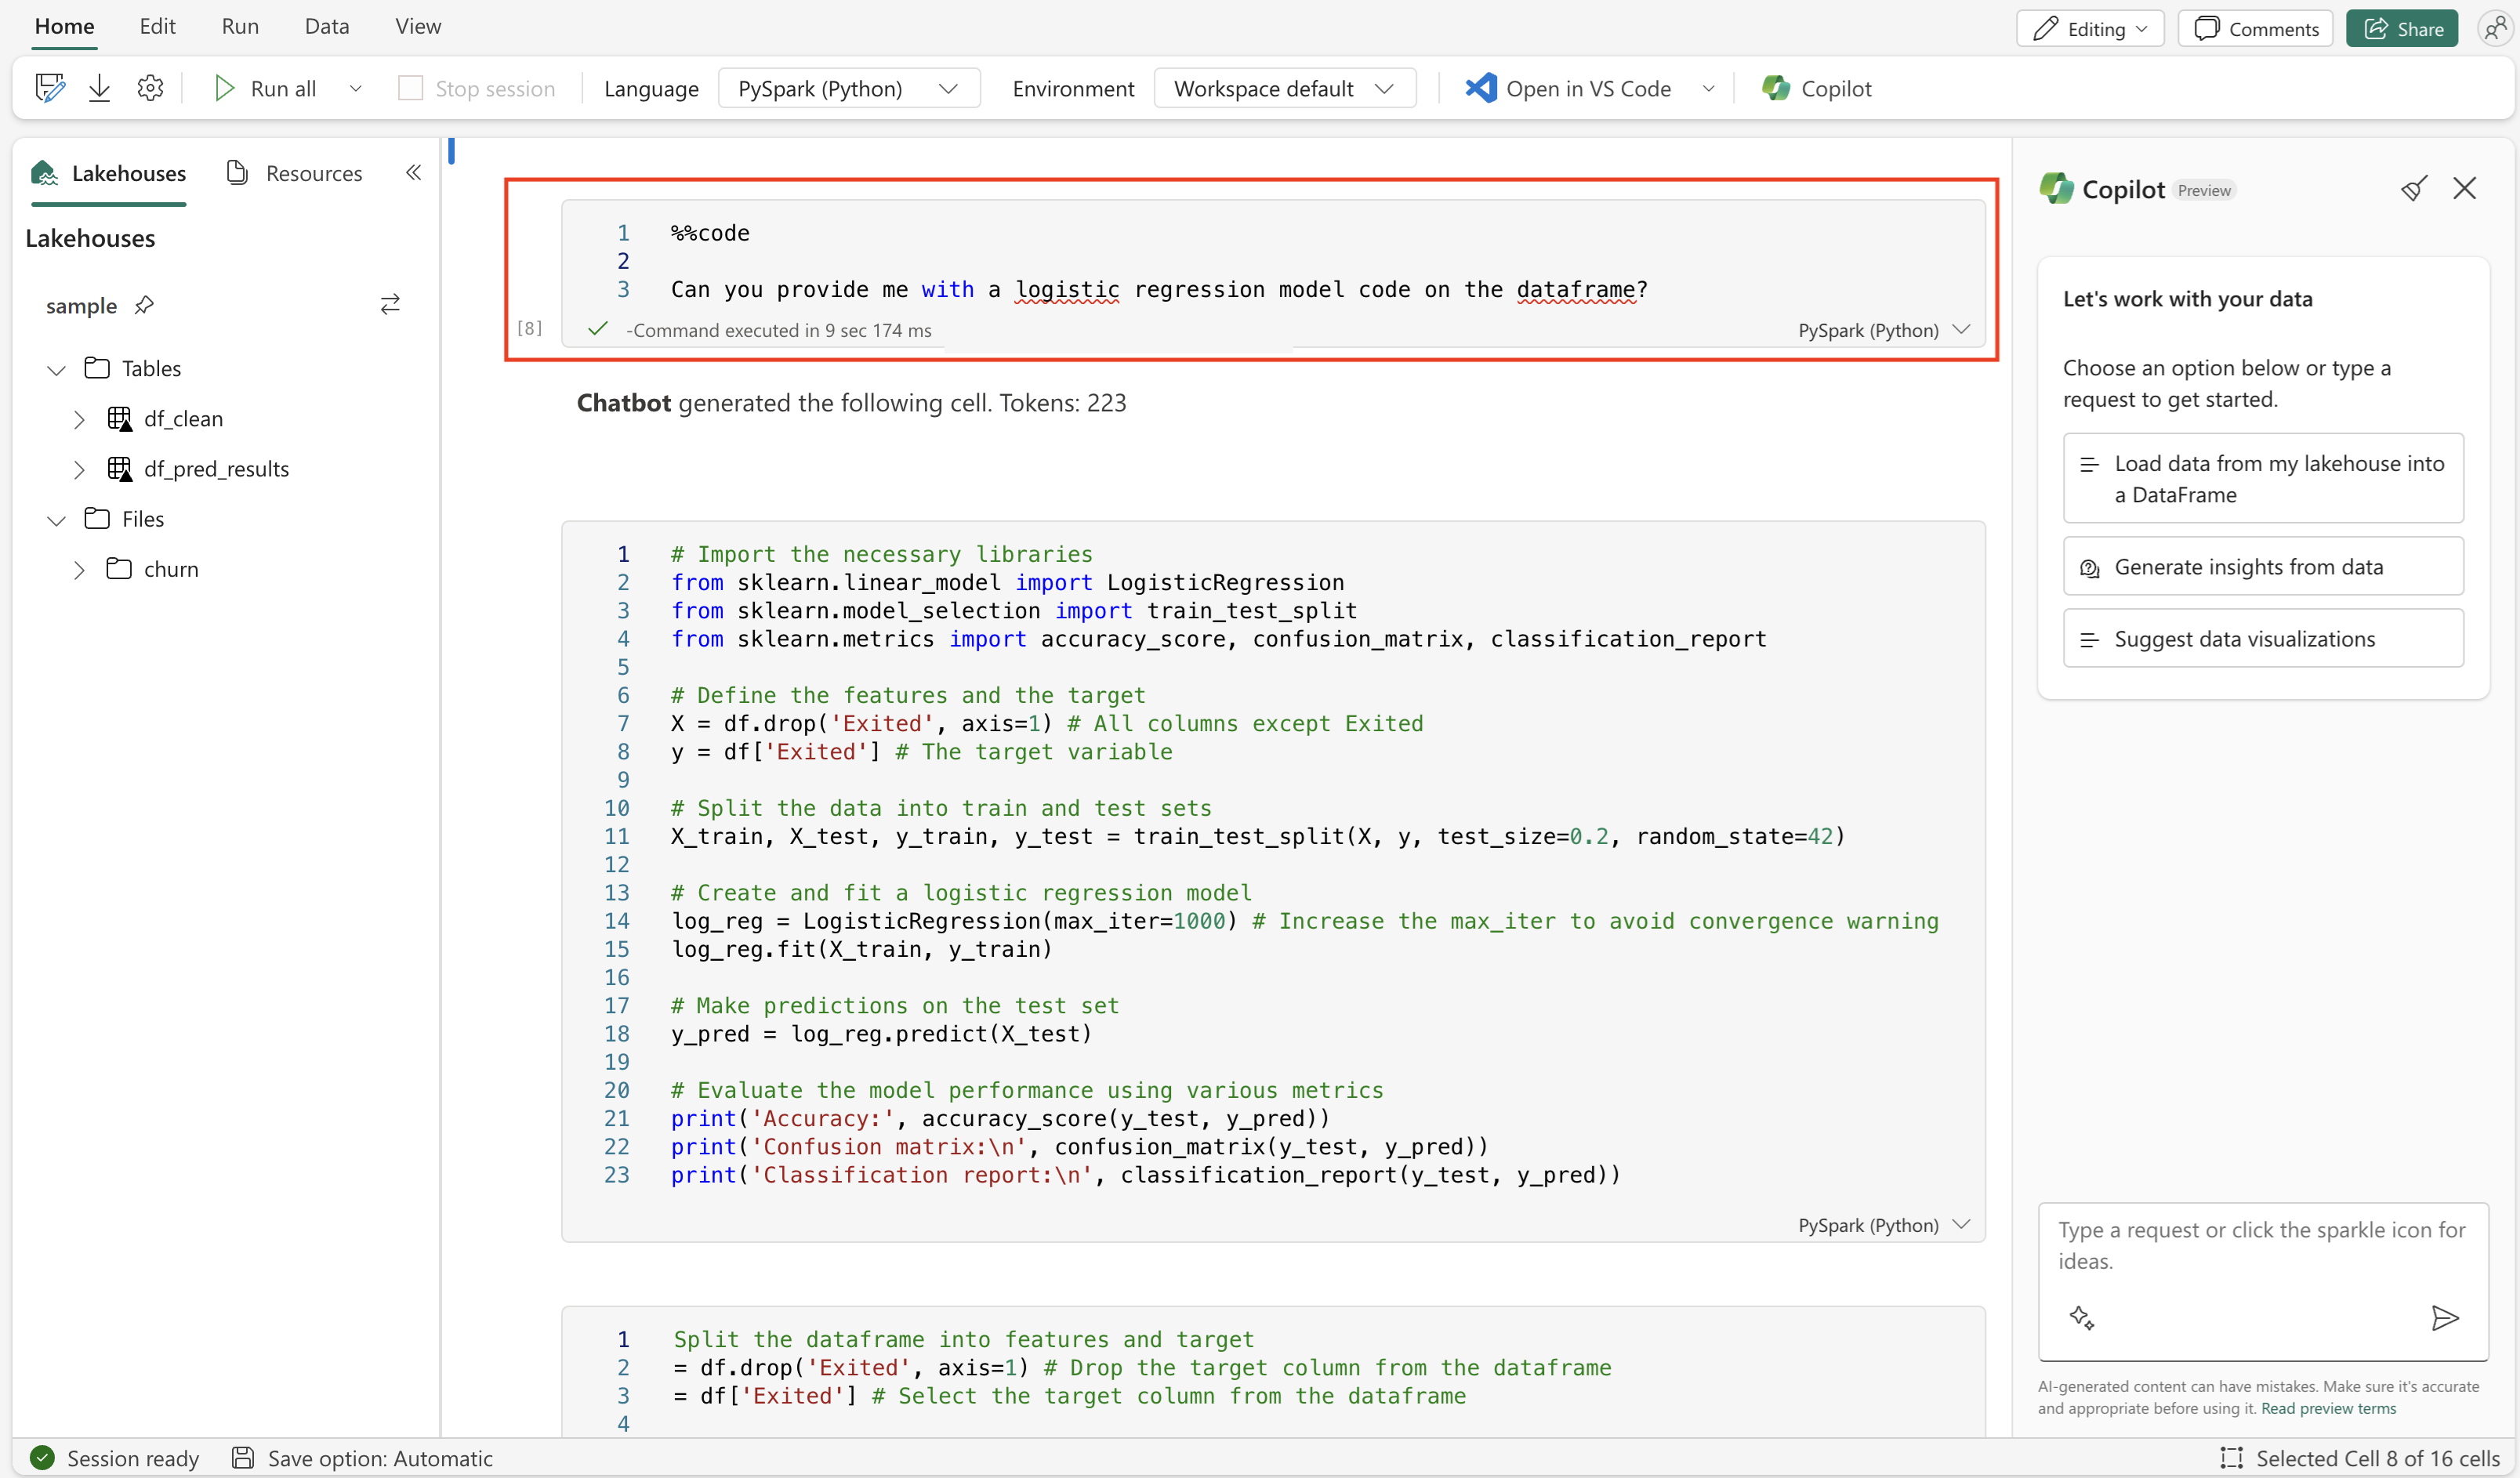
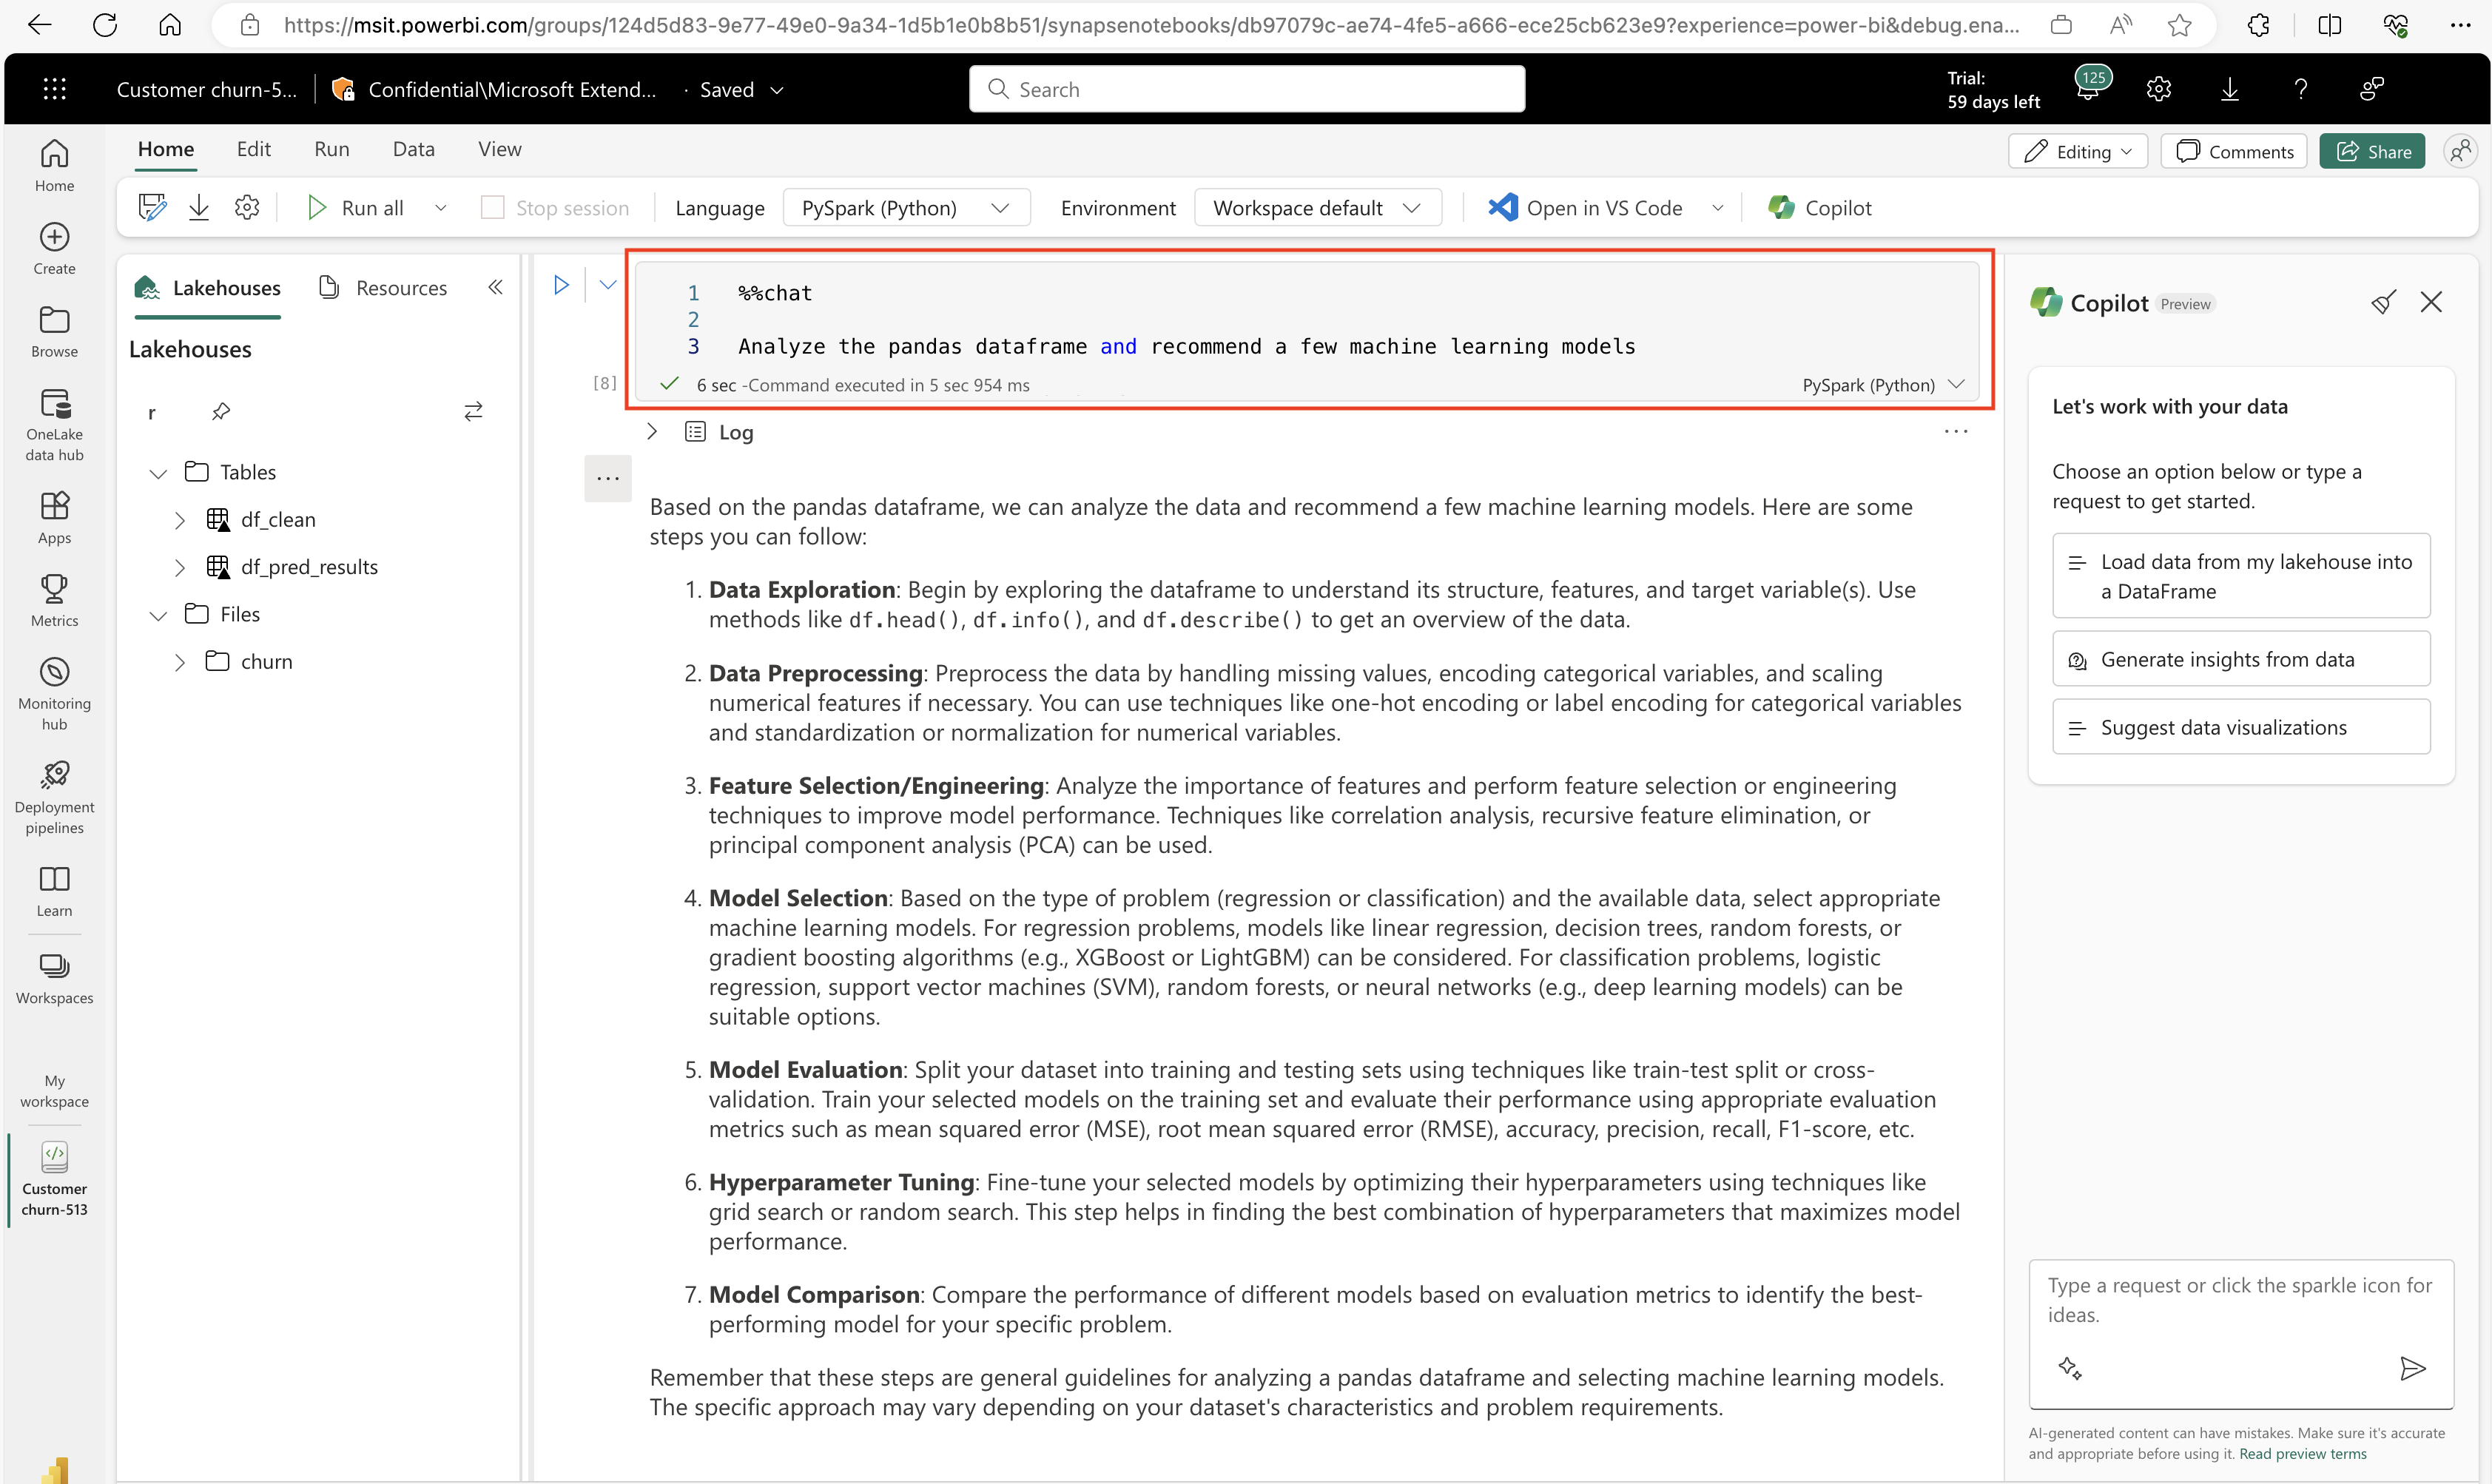
As you use Copilot, you can also invoke the magic commands inside of a notebook cell to obtain output directly in the notebook. For example, for natural language answers to responses, you can ask questions using the "%%chat" command, such as:
%%chat
What are some machine learning models that may fit this dataset?
or
%%code
Can you generate code for a logistic regression that fits this data?
Copilot for Data Science and Data Engineering also has schema and metadata awareness of tables in the lakehouse. Copilot can provide relevant information in context of your data in an attached lakehouse. For example, you can ask:
- "How many tables are in the lakehouse?"
- "What are the columns of the table customers?"
Copilot responds with the relevant information if you added the lakehouse to the notebook. Copilot also has awareness of the names of files added to any lakehouse attached to the notebook. You can refer to those files by name in your chat. For example, if you have a file named sales.csv in your lakehouse, you can ask "Create a dataframe from sales.csv". Copilot generates the code and displays it in the chat panel. With Copilot for notebooks, you can easily access and query your data from different sources. You don't need the exact command syntax to do it.
Tips
- "Clear" your conversation in the Copilot chat panel with the broom located at the top of the chat panel. Copilot retains knowledge of any inputs or outputs during the session, but this helps if you find the current content distracting.
- Use the chat magics library to configure settings about Copilot, including privacy settings. The default sharing mode is designed to maximize the context sharing Copilot has access to, so limiting the information provided to copilot can directly and significantly impact the relevance of its responses.
- When Copilot first launches, it offers a set of helpful prompts that can help you get started. They can help kickstart your conversation with Copilot. To refer to prompts later, you can use the sparkle button at the bottom of the chat panel.
- You can "drag" the sidebar of the copilot chat to expand the chat panel, to view code more clearly or for readability of the outputs on your screen.
Limitations
Copilot features in the Data Science experience are currently scoped to notebooks. These features include the Copilot chat pane, IPython magic commands that can be used within a code cell, and automatic code suggestions as you type in a code cell. Copilot can also read Power BI semantic models using an integration of semantic link.
Copilot has two key intended uses:
- One, you can ask Copilot to examine and analyze data in your notebook (for example, by first loading a DataFrame and then asking Copilot about data inside the DataFrame).
- Two, you can ask Copilot to generate a range of suggestions about your data analysis process, such as what predictive models might be relevant, code to perform different types of data analysis, and documentation for a completed notebook.
Keep in mind that code generation with fast-moving or recently released libraries might include inaccuracies or fabrications.


