Datos del punto de agrupación en clústeres en el SDK de iOS (versión preliminar)
Nota:
Retirada del SDK de Azure Maps para iOS
El SDK nativo de Azure Maps para iOS ya está en desuso y se retirará el 31 de marzo de 2025. Para evitar interrupciones del servicio, migre al SDK web de Azure Maps antes del 31 de marzo de 2025. Para más información, vea la Guía de migración del SDK de Azure Maps para iOS.
Cuando se muestran muchos puntos de datos en el mapa, los puntos pueden superponerse entre sí. Este solapamiento puede hacer que el mapa resulte ilegible y difícil de usar. La agrupación en clústeres de datos de punto es el proceso de combinar datos de punto que están cerca unos de otros y representarlos en el mapa como un único punto de datos agrupados en clúster. Cuando el usuario acerca el mapa, los clústeres se separan en sus puntos de datos individuales. Cuando trabaje con un gran número de puntos de datos, utilice procesos de agrupación en clústeres para mejorar la experiencia del usuario.
Muestra de Internet de las cosas: agrupación en clústeres de datos de punto en Azure Maps
Requisitos previos
Asegúrese de completar los pasos descritos en el documento Inicio rápido: creación de una aplicación para iOS. Los bloques de código de este artículo se pueden insertar en la función viewDidLoad de ViewController.
Habilitar la agrupación en clústeres en un origen de datos
Habilite la agrupación en clústeres en la clase DataSource estableciendo la opción cluster en true. Establezca clusterRadius para seleccionar puntos de datos cercanos y combinarlos en un clúster. El valor de clusterRadius está en los puntos. Use clusterMaxZoom para especificar el nivel de zoom en el que se debe deshabilitar la lógica de agrupación en clústeres. Este es un ejemplo de cómo habilitar la agrupación en clústeres en un origen de datos.
// Create a data source and enable clustering.
let source = DataSource(options: [
    //Tell the data source to cluster point data.
    .cluster(true),

    //The radius in points to cluster data points together.
    .clusterRadius(45),

    //The maximum zoom level in which clustering occurs.
    //If you zoom in more than this, all points are rendered as symbols.
    .clusterMaxZoom(15)
])
Precaución
La agrupación en clústeres solo funciona con características Point. Si el origen de datos contiene características de otros tipos de geometría, como Polyline o Polygon, se producirá un error.
Sugerencia
Si dos puntos de datos están muy próximos en la superficie, es posible que nunca se separen, con independencia de lo mucho que el usuario acerque el mapa. Para solucionarlo, puede establecer la opción clusterMaxZoom para que la lógica de agrupación en clústeres se deshabilite y se muestren todos los elementos.
La clase DataSource también proporciona los siguientes métodos relacionados con la agrupación en clústeres.
| Método | Tipo de valor devuelto | Descripción |
|---|---|---|
children(of cluster: Feature) |
[Feature] |
Recupera los elementos secundarios del clúster especificado en el siguiente nivel de zoom. Estos elementos secundarios pueden ser una combinación de característica y subclústeres. Los subclústeres se convertirán en características con propiedades que coincidan con ClusteredProperties. |
zoomLevel(forExpanding cluster: Feature) |
Double |
Calcula un nivel de zoom en el que el clúster empieza a expandirse o separarse. |
leaves(of cluster: Feature, offset: UInt, limit: UInt) |
[Feature] |
Recupera todos los puntos de un clúster. Establezca limit para que devuelva un subconjunto de los puntos y use offset para paginar a través de los puntos. |
Mostrar clústeres con una capa de burbujas
Una capa de burbujas es un mecanismo ideal para representar los puntos de datos agrupados en clústeres. Utilice expresiones para escalar el radio y cambiar el color en función del número de puntos del clúster. Si los clústeres se muestran utilizando una capa de burbujas, deberá usar también otra capa diferente para representar los puntos de datos no agrupados.
Para mostrar el tamaño del clúster encima de la burbuja, utilice una capa de símbolos y no utilice iconos.
El código siguiente muestra los puntos agrupados en clústeres mediante una capa de burbujas, y el número de puntos en cada clúster mediante una capa de símbolos. Se usa una segunda capa de símbolos para mostrar puntos individuales que no están dentro de un clúster.
// Create a data source and enable clustering.
let source = DataSource(options: [
    // Tell the data source to cluster point data.
    .cluster(true),

    // The radius in points to cluster data points together.
    .clusterRadius(45),

    // The maximum zoom level in which clustering occurs.
    // If you zoom in more than this, all points are rendered as symbols.
    .clusterMaxZoom(15)
])

// Import the geojson data and add it to the data source.
let url = URL(string: "https://earthquake.usgs.gov/earthquakes/feed/v1.0/summary/all_week.geojson")!
source.importData(fromURL: url)

// Add data source to the map.
map.sources.add(source)

// Create a bubble layer for rendering clustered data points.
map.layers.addLayer(
    BubbleLayer(
        source: source,
        options: [
            // Scale the size of the clustered bubble based on the number of points in the cluster.
            .bubbleRadius(
                from: NSExpression(
                    forAZMStepping: NSExpression(forKeyPath: "point_count"),
                    // Default of 20 point radius.
                    from: NSExpression(forConstantValue: 20),
                    stops: NSExpression(forConstantValue: [

                        // If point_count >= 100, radius is 30 points.
                        100: 30,

                        // If point_count >= 750, radius is 40 points.
                        750: 40
                    ])
                )
            ),

            // Change the color of the cluster based on the value on the point_count property of the cluster.
            .bubbleColor(
                from: NSExpression(
                    forAZMStepping: NSExpression(forKeyPath: "point_count"),
                    // Default to green.
                    from: NSExpression(forConstantValue: UIColor.green),
                    stops: NSExpression(forConstantValue: [

                        // If the point_count >= 100, color is yellow.
                        100: UIColor.yellow,

                        // If the point_count >= 100, color is red.
                        750: UIColor.red
                    ])
                )
            ),
            .bubbleStrokeWidth(0),

            // Only rendered data points which have a point_count property, which clusters do.
            .filter(from: NSPredicate(format: "point_count != NIL"))
        ]
    )
)

// Create a symbol layer to render the count of locations in a cluster.
map.layers.addLayer(
    SymbolLayer(
        source: source,
        options: [
            // Hide the icon image.
            .iconImage(nil),

            // Display the point count as text.
            .textField(from: NSExpression(forKeyPath: "point_count")),
            .textOffset(CGVector(dx: 0, dy: 0.4)),
            .textAllowOverlap(true),

            // Allow clustered points in this layer.
            .filter(from: NSPredicate(format: "point_count != NIL"))
        ]
    )
)

// Create a layer to render the individual locations.
map.layers.addLayer(
    SymbolLayer(
        source: source,
        options: [
            // Filter out clustered points from this layer.
            .filter(from: NSPredicate(format: "point_count = NIL"))
        ]
    )
)
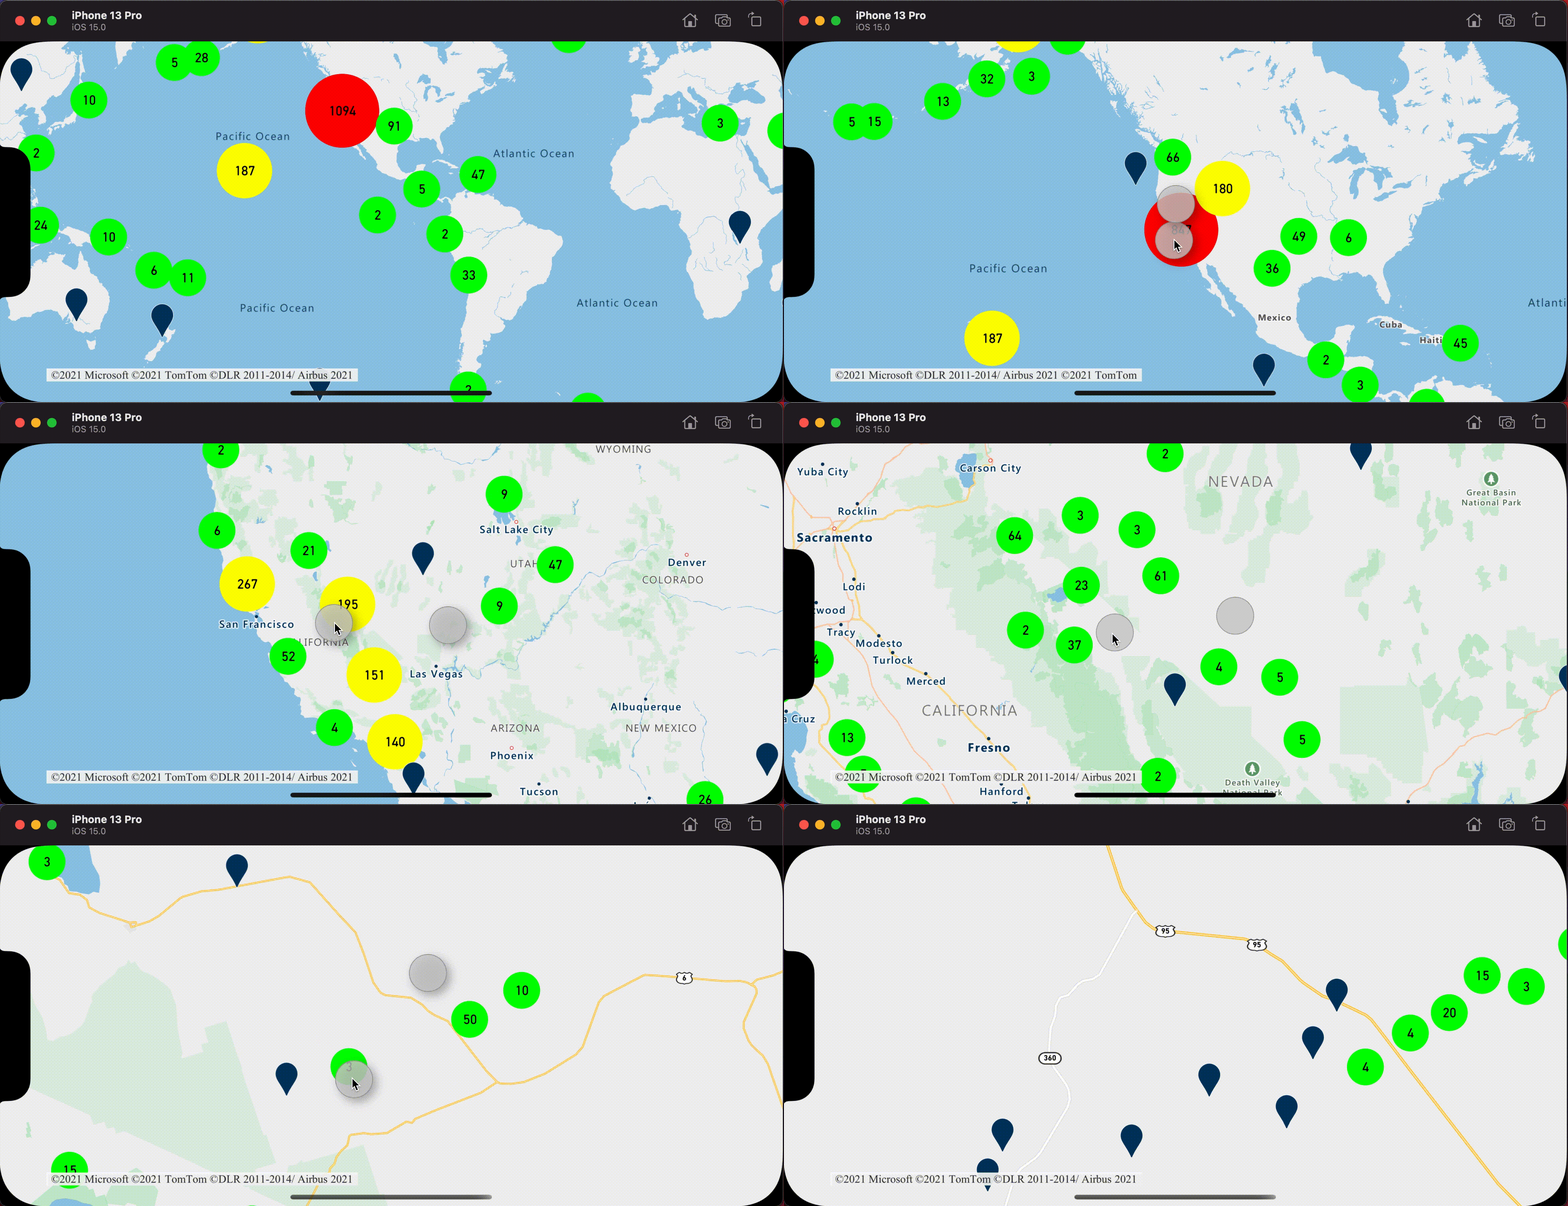
En la imagen siguiente se muestran las características de puntos agrupados en clústeres del código anterior en una capa de burbujas, escaladas y coloreadas en función del número de puntos del clúster. Los puntos no agrupados en clústeres se representan mediante una capa de símbolos.
Mostrar clústeres con una capa de símbolos
Cuando se muestran puntos de datos, la capa de símbolos oculta automáticamente los símbolos que se solapan entre sí para que la interfaz de usuario se vea más limpia. Este comportamiento predeterminado podría no resultar conveniente si desea mostrar la densidad de puntos de datos en el mapa. Sin embargo, esta configuración se puede cambiar. Para mostrar todos los símbolos, establezca la opción iconAllowOverlap de la capa de símbolos en true.
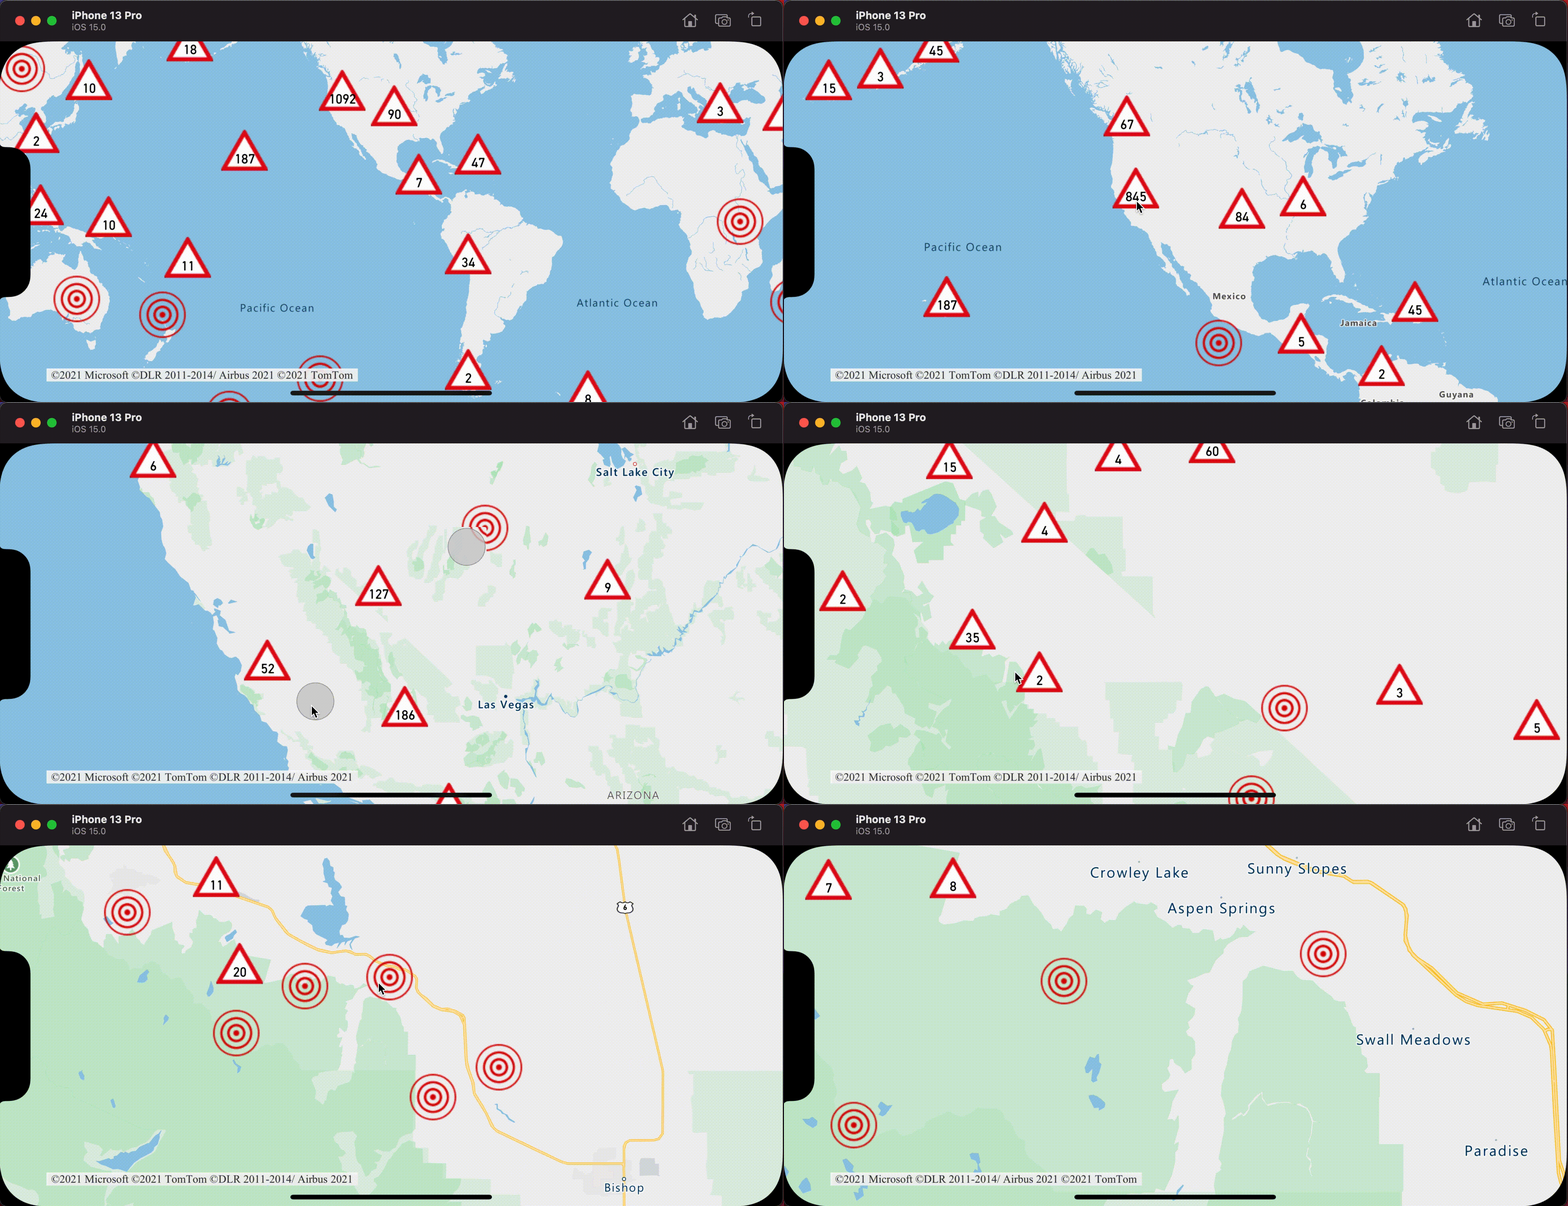
Utilice la agrupación en clústeres para mostrar la densidad de puntos de datos y, al mismo tiempo, que la interfaz de usuario se vea limpia. En el ejemplo siguiente, se muestra cómo se agregan símbolos personalizados y cómo se representan clústeres y puntos de datos individuales utilizando la capa de símbolos.
// Load all the custom image icons into the map resources.
map.images.add(UIImage(named: "earthquake_icon")!, withID: "earthquake_icon")
map.images.add(UIImage(named: "warning-triangle-icon")!, withID: "warning-triangle-icon")

// Create a data source and add it to the map.
let source = DataSource(options: [
    // Tell the data source to cluster point data.
    .cluster(true)
])

// Import the geojson data and add it to the data source.
let url = URL(string: "https://earthquake.usgs.gov/earthquakes/feed/v1.0/summary/all_week.geojson")!
source.importData(fromURL: url)

// Add data source to the map.
map.sources.add(source)

// Create a layer to render the individual locations.
map.layers.addLayer(
    SymbolLayer(
        source: source,
        options: [
            .iconImage("earthquake_icon"),

            // Filter out clustered points from this layer.
            .filter(from: NSPredicate(format: "point_count = NIL"))
        ]
    )
)

// Create a symbol layer to render the clusters.
map.layers.addLayer(
    SymbolLayer(
        source: source,
        options: [
            .iconImage("warning-triangle-icon"),
            .textField(from: NSExpression(forKeyPath: "point_count")),
            .textOffset(CGVector(dx: 0, dy: -0.4)),

            // Allow clustered points in this layer.
            .filter(from: NSPredicate(format: "point_count != NIL"))
        ]
    )
)
En este ejemplo, la siguiente imagen se carga en la carpeta assets de la aplicación.
| earthquake-icon.png | warning-triangle-icon.png |
En la imagen siguiente se muestran las características de punto agrupado y no agrupado en clústeres de representación de código anterior mediante iconos personalizados.
Agrupación en clústeres y capa de mapas térmicos
Los mapas térmicos son una excelente manera de mostrar la densidad de los datos en el mapa. Este método de visualización puede administrar un gran número de puntos de datos por sí solo. Si los puntos de datos están agrupados en clústeres y el tamaño del clúster se utiliza como ponderación del mapa térmico, este mapa podrá administrar aún más datos. Para ello, establezca la opción heatmapWeight de la capa del mapa térmico en NSExpression(forKeyPath: "point_count"). Si el radio del clúster es pequeño, el mapa térmico será casi idéntico a un mapa térmico que use puntos de datos no agrupados en clústeres, pero funcionará mejor. Sin embargo, cuanto menor sea el radio del clúster, más preciso será el mapa térmico, aunque también menos beneficioso para el rendimiento.
// Create a data source and enable clustering.
let source = DataSource(options: [
    // Tell the data source to cluster point data.
    .cluster(true),

    // The radius in points to cluster points together.
    .clusterRadius(10)
])

// Import the geojson data and add it to the data source.
let url = URL(string: "https://earthquake.usgs.gov/earthquakes/feed/v1.0/summary/all_week.geojson")!
source.importData(fromURL: url)

// Add data source to the map.
map.sources.add(source)

// Create a heat map and add it to the map.
map.layers.insertLayer(
    HeatMapLayer(
        source: source,
        options: [
            // Set the weight to the point_count property of the data points.
            .heatmapWeight(from: NSExpression(forKeyPath: "point_count")),

            // Optionally adjust the radius of each heat point.
            .heatmapRadius(20)
        ]
    ),
    below: "labels"
)
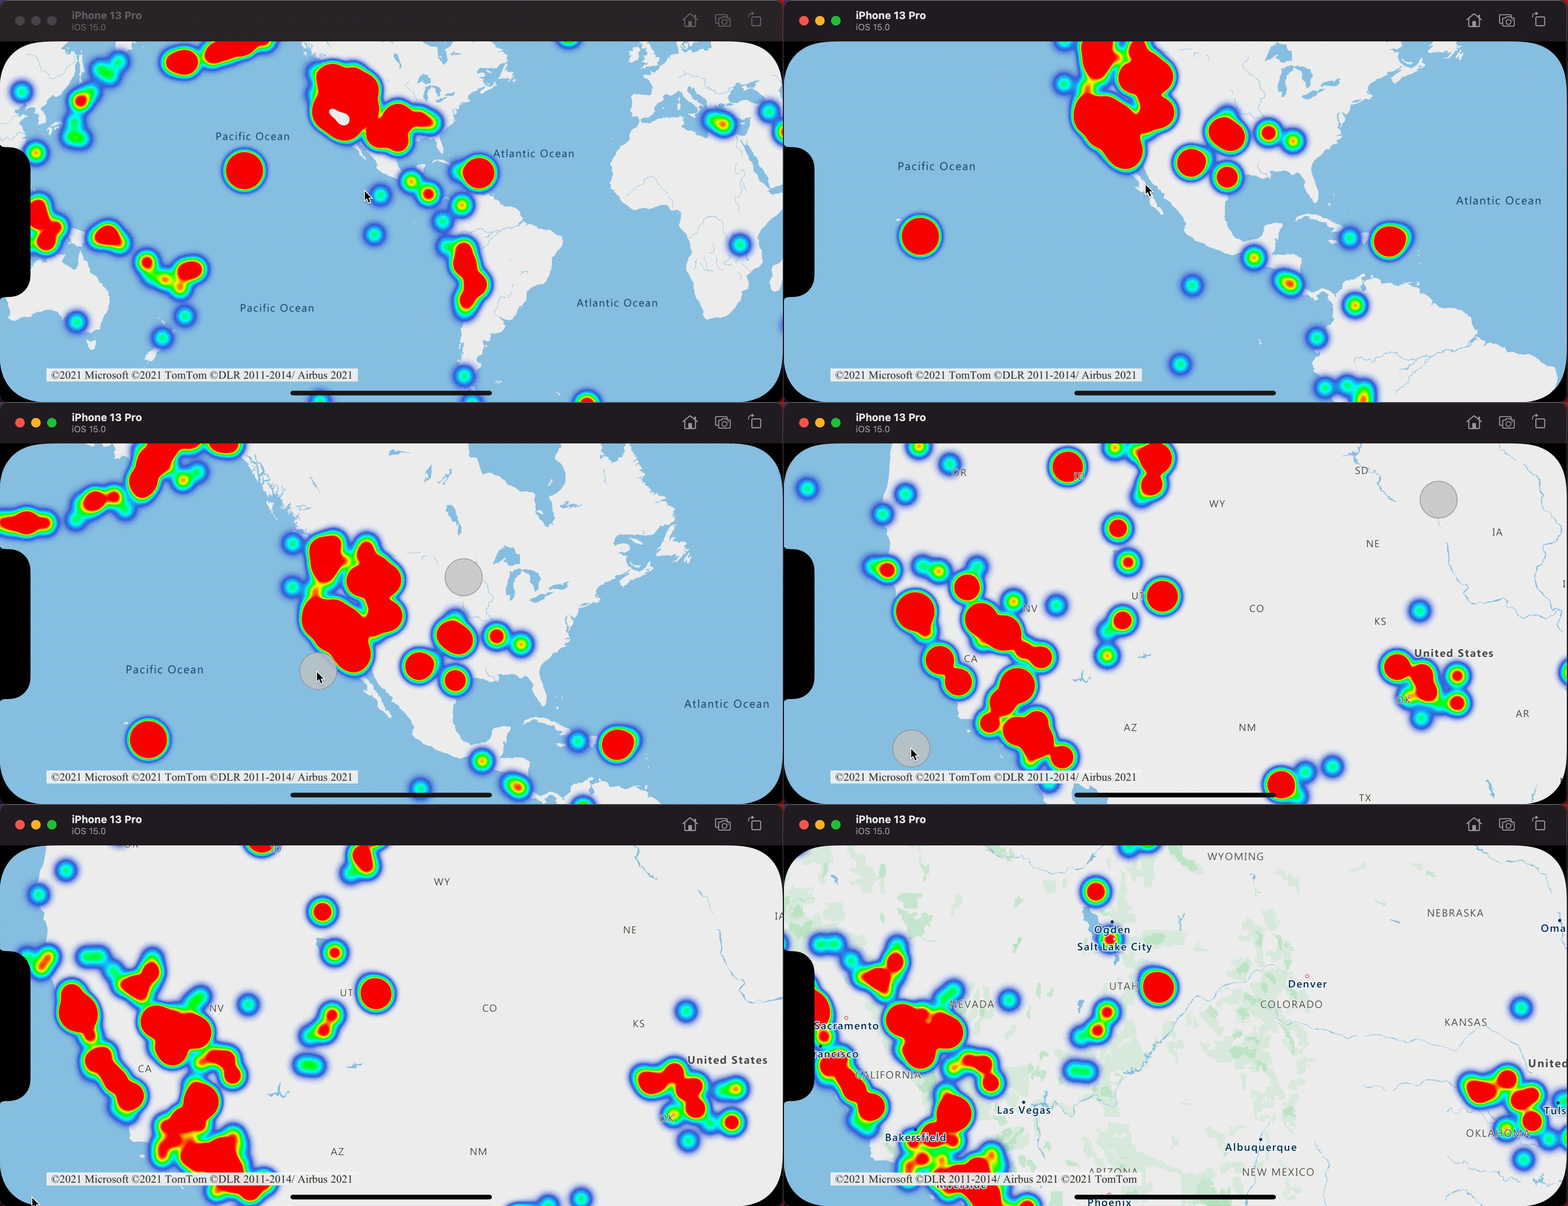
En la imagen siguiente el código anterior muestra un mapa térmico optimizado mediante características de puntos agrupados en clústeres que utiliza el recuento de clústeres como peso en el mapa térmico.
Eventos de pulsación en los puntos de datos agrupados en clúster
Si se producen eventos de pulsación en una capa que contiene puntos de datos agrupados en clústeres, se devolverán los puntos de datos agrupados para el evento como un objeto de característica de punto de GeoJSON. La característica de punto tiene las siguientes propiedades:
| Nombre de propiedad | Type | Description |
|---|---|---|
cluster |
boolean | Indica si la característica representa un clúster. |
point_count |
number | El número de puntos que contiene el clúster. |
point_count_abbreviated |
string | Cadena que abrevia el valor de point_count, si es muy largo. (por ejemplo, 4000 se convierte en 4 K). |
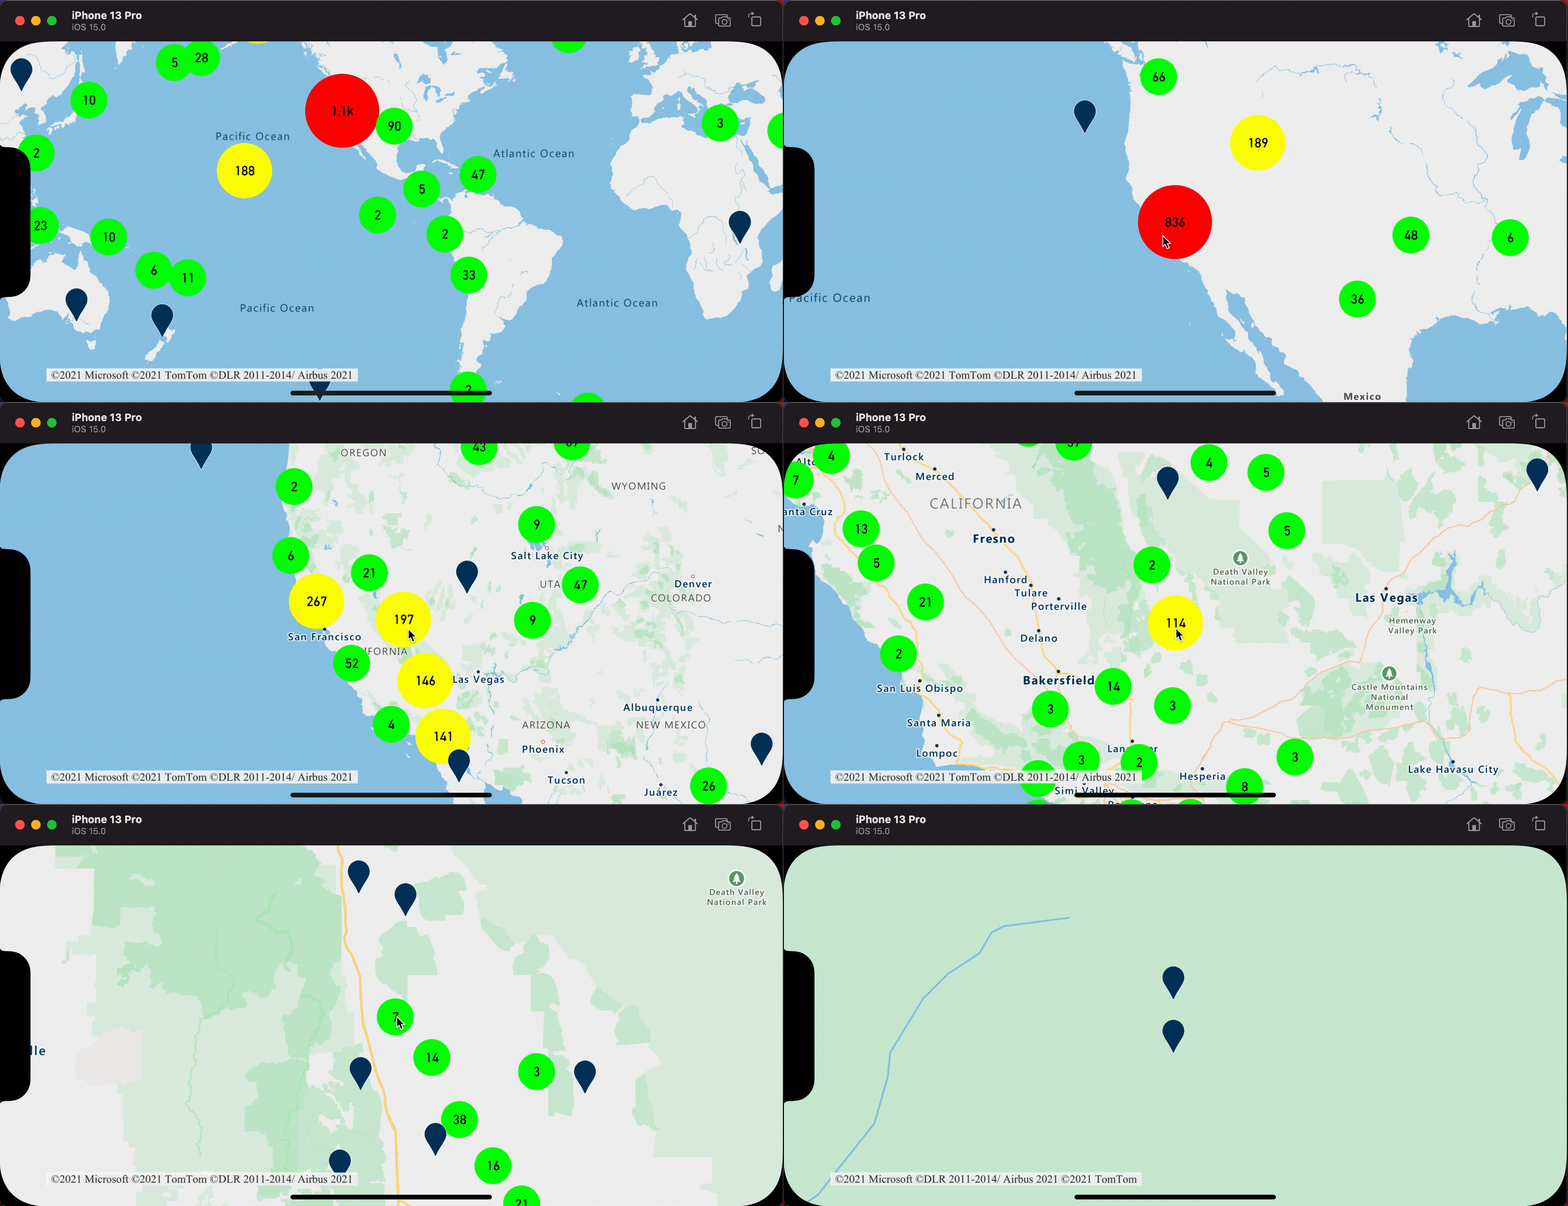
En este ejemplo, se toma la capa de burbujas que representa los puntos del clúster y se agrega un evento de pulsación. Cuando el evento de pulsación se desencadena, el código realiza los cálculos y aplica el zoom en el mapa para llevarlo al siguiente nivel, donde el clúster se separa. Esta funcionalidad se implementa mediante el método zoomLevel(forExpanding:) de la clase DataSource.
// Create a data source and enable clustering.
let source = DataSource(options: [
    // Tell the data source to cluster point data.
    .cluster(true),

    // The radius in points to cluster data points together.
    .clusterRadius(45),

    // The maximum zoom level in which clustering occurs.
    // If you zoom in more than this, all points are rendered as symbols.
    .clusterMaxZoom(15)
])

// Set data source to the class property to use in events handling later.
self.source = source

// Import the geojson data and add it to the data source.
let url = URL(string: "https://earthquake.usgs.gov/earthquakes/feed/v1.0/summary/all_week.geojson")!
source.importData(fromURL: url)

// Add data source to the map.
map.sources.add(source)

// Create a bubble layer for rendering clustered data points.
let clusterBubbleLayer = BubbleLayer(
    source: source,
    options: [
        // Scale the size of the clustered bubble based on the number of points in the cluster.
        .bubbleRadius(
            from: NSExpression(
                forAZMStepping: NSExpression(forKeyPath: "point_count"),
                // Default of 20 point radius.
                from: NSExpression(forConstantValue: 20),
                stops: NSExpression(forConstantValue: [
                    // If point_count >= 100, radius is 30 points.
                    100: 30,

                    // If point_count >= 750, radius is 40 points.
                    750: 40
                ])
            )
        ),

        // Change the color of the cluster based on the value on the point_count property of the cluster.
        .bubbleColor(
            from: NSExpression(
                forAZMStepping: NSExpression(forKeyPath: "point_count"),
                // Default to green.
                from: NSExpression(forConstantValue: UIColor.green),
                stops: NSExpression(forConstantValue: [
                    // If the point_count >= 100, color is yellow.
                    100: UIColor.yellow,

                    // If the point_count >= 100, color is red.
                    750: UIColor.red
                ])
            )
        ),
        .bubbleStrokeWidth(0),

        // Only rendered data points which have a point_count property, which clusters do.
        .filter(from: NSPredicate(format: "point_count != NIL"))
    ]
)

// Add the clusterBubbleLayer to the map.
map.layers.addLayer(clusterBubbleLayer)

// Create a symbol layer to render the count of locations in a cluster.
map.layers.addLayer(
    SymbolLayer(
        source: source,
        options: [
            // Hide the icon image.
            .iconImage(nil),

            // Display the point count as text.
            .textField(from: NSExpression(forKeyPath: "point_count_abbreviated")),

            // Offset the text position so that it's centered nicely.
            .textOffset(CGVector(dx: 0, dy: 0.4)),

            // Allow text overlapping so text is visible anyway
            .textAllowOverlap(true),

            // Allow clustered points in this layer.
            .filter(from: NSPredicate(format: "point_count != NIL"))
        ]
    )
)

// Create a layer to render the individual locations.
map.layers.addLayer(
    SymbolLayer(
        source: source,
        options: [
            // Filter out clustered points from this layer.
            .filter(from: NSPredicate(format: "point_count = NIL"))
        ]
    )
)

// Add the delegate to handle taps on the clusterBubbleLayer only.
map.events.addDelegate(self, for: [clusterBubbleLayer.id])
func azureMap(_ map: AzureMap, didTapOn features: [Feature]) {
    guard let source = source, let cluster = features.first else {
        // Data source have been released or no features provided
        return
    }

    // Get the cluster expansion zoom level. This is the zoom level at which the cluster starts to break apart.
    let expansionZoom = source.zoomLevel(forExpanding: cluster)

    // Update the map camera to be centered over the cluster.
    map.setCameraOptions([
        // Center the map over the cluster points location.
        .center(cluster.coordinate),

        // Zoom to the clusters expansion zoom level.
        .zoom(expansionZoom),

        // Animate the movement of the camera to the new position.
        .animationType(.ease),
        .animationDuration(200)
    ])
}
En la imagen siguiente, el código anterior muestra los puntos agrupados en clústeres en un mapa que, cuando se pulsa, se amplía al siguiente nivel de zoom en el que el clúster empieza a separarse y expandirse.
Mostrar área de clúster
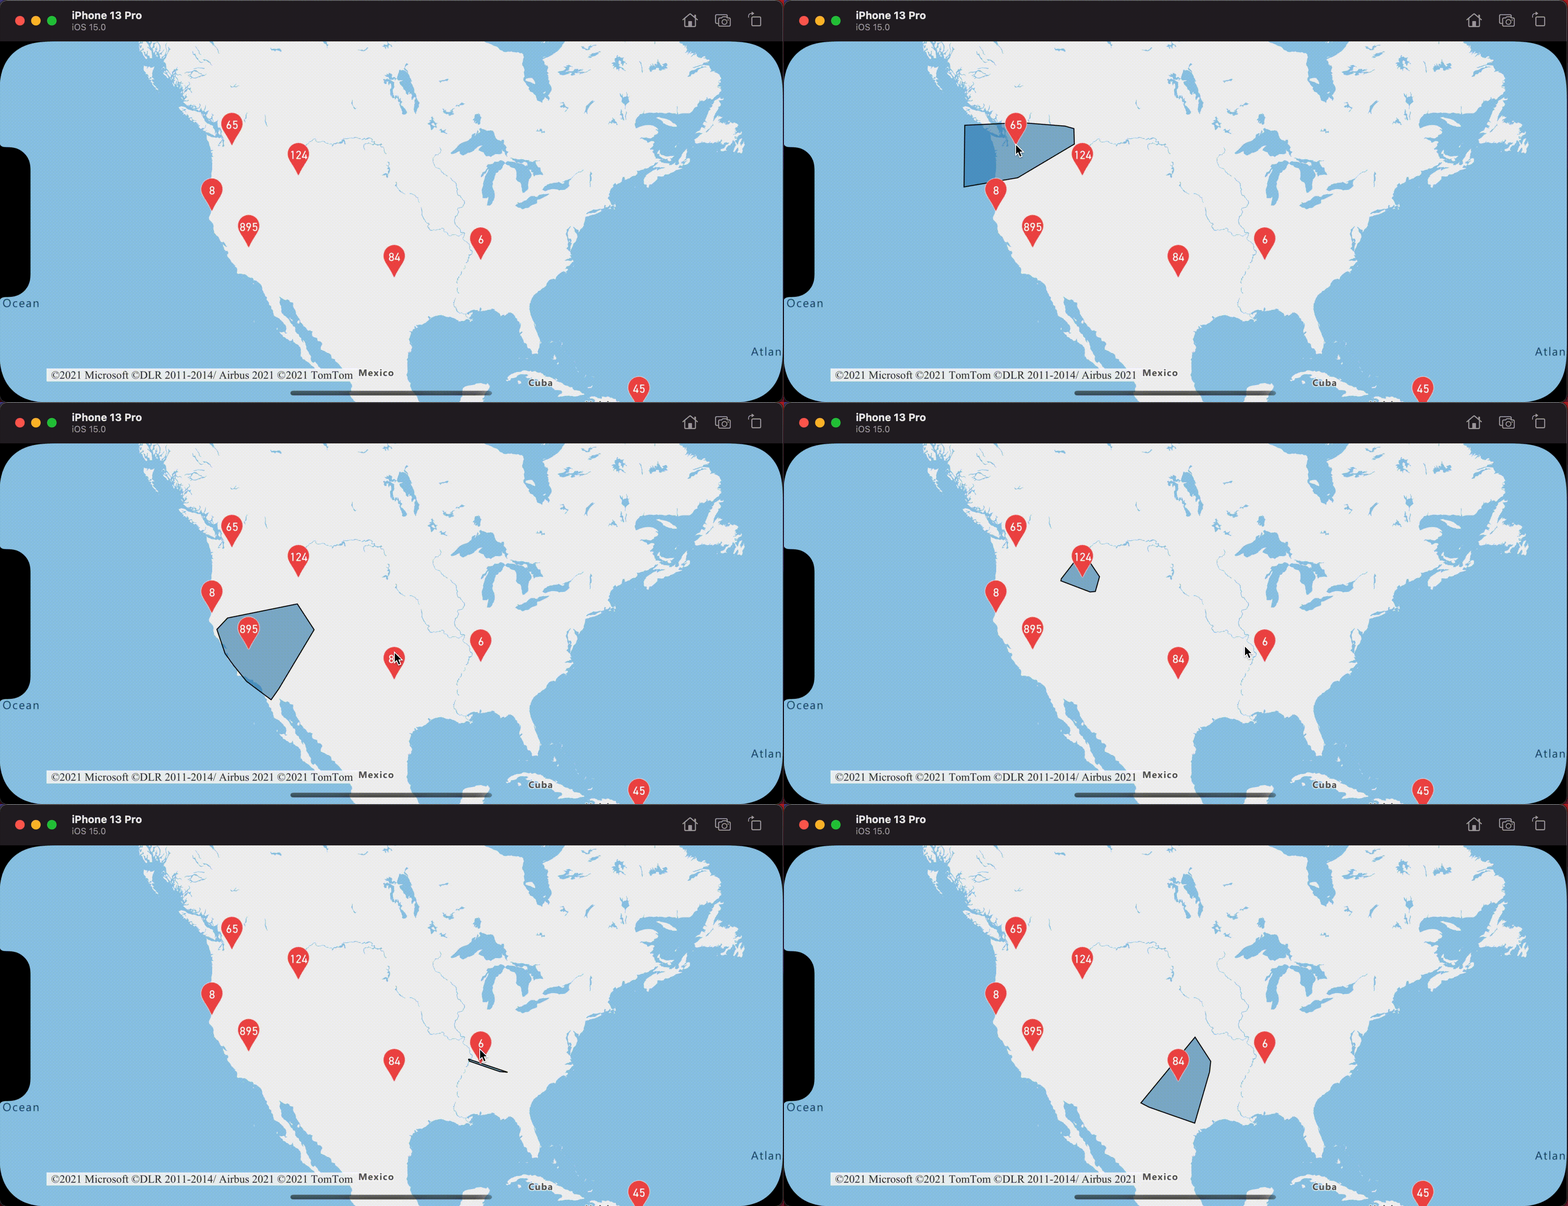
Los datos de punto que un clúster representa se dispersan por un área. En este ejemplo, cuando se pulsa un clúster, se producen dos comportamientos principales. En primer lugar, los puntos de datos individuales incluidos en el clúster se utilizan para calcular la envolvente convexa. Después, la envolvente convexa aparece en el mapa para mostrar un área. Una envolvente convexa es un polígono que encapsula un conjunto de puntos como una banda elástica y puede calcularse mediante el método convexHull(from:). Se pueden recuperar todos los puntos del origen de datos contenidos en un clúster mediante el método leaves(of:offset:limit:).
// Create a data source and enable clustering.
let source = DataSource(options: [
    // Tell the data source to cluster point data.
    .cluster(true)
])

// Set data source to the class property to use in events handling later.
self.source = source

// Import the geojson data and add it to the data source.
let url = URL(string: "https://earthquake.usgs.gov/earthquakes/feed/v1.0/summary/all_week.geojson")!
source.importData(fromURL: url)

// Add data source to the map.
map.sources.add(source)

// Create a data source for the convex hull polygon.
// Since this will be updated frequently it is more efficient to separate this into its own data source.
let polygonDataSource = DataSource()

// Set polygon data source to the class property to use in events handling later.
self.polygonDataSource = polygonDataSource

// Add data source to the map.
map.sources.add(polygonDataSource)

// Add a polygon layer and a line layer to display the convex hull.
map.layers.addLayer(PolygonLayer(source: polygonDataSource))
map.layers.addLayer(LineLayer(source: polygonDataSource))

// Load an icon into the image sprite of the map.
map.images.add(.azm_markerRed, withID: "marker-red")

// Create a symbol layer to render the clusters.
let clusterLayer = SymbolLayer(
    source: source,
    options: [
        .iconImage("marker-red"),
        .textField(from: NSExpression(forKeyPath: "point_count_abbreviated")),
        .textOffset(CGVector(dx: 0, dy: -1.2)),
        .textColor(.white),
        .textSize(14),

        // Only rendered data points which have a point_count property, which clusters do.
        .filter(from: NSPredicate(format: "point_count != NIL"))
    ]
)

// Add the clusterLayer to the map.
map.layers.addLayer(clusterLayer)

// Create a layer to render the individual locations.
map.layers.addLayer(
    SymbolLayer(
        source: source,
        options: [
            // Filter out clustered points from this layer.
            .filter(from: NSPredicate(format: "point_count = NIL"))
        ]
    )
)

// Add the delegate to handle taps on the clusterLayer only
// and then calculate the convex hull of all the points within a cluster.
map.events.addDelegate(self, for: [clusterLayer.id])
func azureMap(_ map: AzureMap, didTapOn features: [Feature]) {
    guard let source = source, let polygonDataSource = polygonDataSource, let cluster = features.first else {
        // Data source have been released or no features provided
        return
    }

    // Get all points in the cluster. Set the offset to 0 and the max int value to return all points.
    let featureLeaves = source.leaves(of: cluster, offset: 0, limit: .max)

    // When only two points in a cluster. Render a line.
    if featureLeaves.count == 2 {

        // Extract the locations from the feature leaves.
        let locations = featureLeaves.map(\.coordinate)

        // Create a line from the points.
        polygonDataSource.set(geometry: Polyline(locations))

        return
    }

    // When more than two points in a cluster. Render a polygon.
    if let hullPolygon = Math.convexHull(from: featureLeaves) {

        // Overwrite all data in the polygon data source with the newly calculated convex hull polygon.
        polygonDataSource.set(geometry: hullPolygon)
    }
}
En la imagen siguiente se muestra el código anterior que muestra el área de todos los puntos dentro de un clúster en el que se ha pulsado.
Agregación de datos en clústeres
Los clústeres suelen representarse utilizando un símbolo con el número de puntos que hay dentro del clúster. Sin embargo, en ocasiones es preferible personalizar el estilo de los clústeres utilizando otras métricas. Con las propiedades del clúster, se pueden crear propiedades personalizadas e iguales a un cálculo basado en las propiedades de cada punto con un clúster. Las propiedades de clúster pueden definirse en la opción clusterProperties de DataSource.
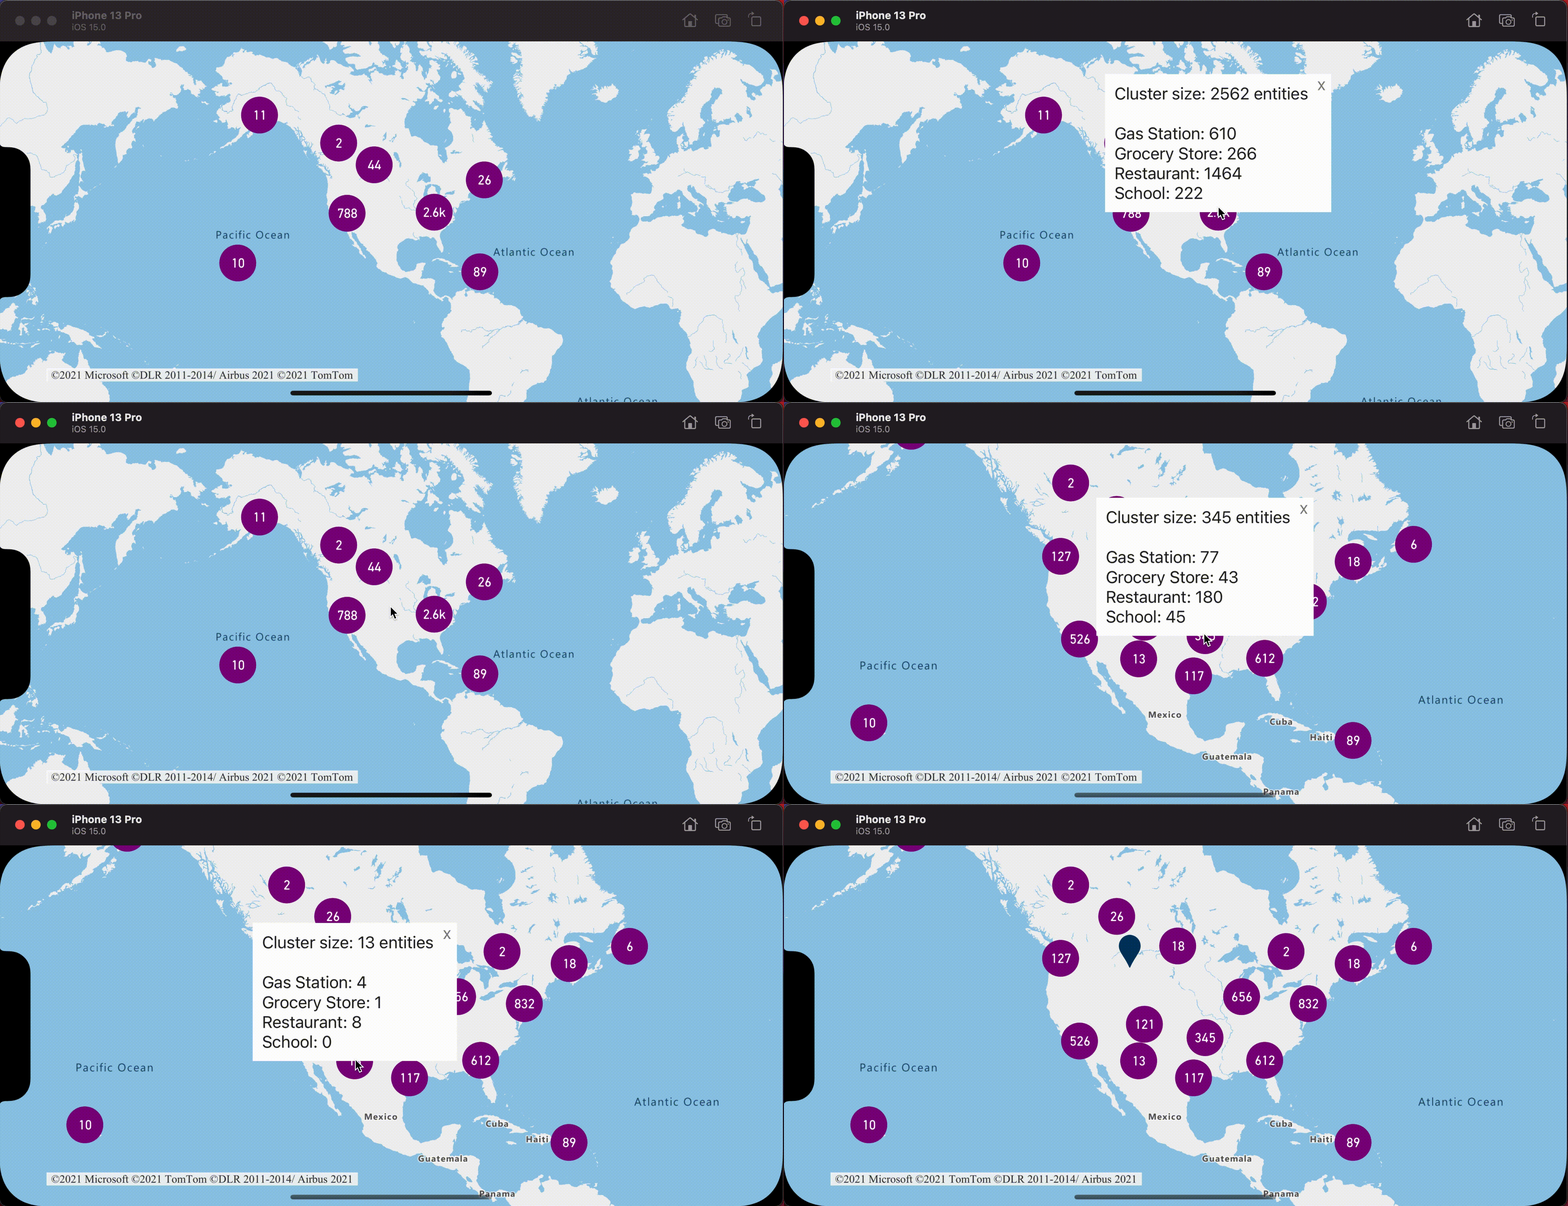
El código siguiente calcula un número en función de la propiedad de tipo de entidad de cada punto de datos del clúster. Cuando un usuario pulsa un clúster, se abre un elemento emergente con información adicional sobre el clúster.
// Create a popup and add it to the map.
let popup = Popup()
map.popups.add(popup)

// Set popup to the class property to use in events handling later.
self.popup = popup

// Close the popup initially.
popup.close()

// Create a data source and enable clustering.
let source = DataSource(options: [
    // Tell the data source to cluster point data.
    .cluster(true),

    // The radius in points to cluster data points together.
    .clusterRadius(50),

    // Calculate counts for each entity type in a cluster as custom aggregate properties.
    .clusterProperties(self.entityTypes.map { entityType in
        ClusterProperty(
            name: entityType,
            operator: NSExpression(
                forFunction: "sum:",
                arguments: [
                    NSExpression.featureAccumulatedAZMVariable,
                    NSExpression(forKeyPath: entityType)
                ]
            ),
            map: NSExpression(
                forConditional: NSPredicate(format: "EntityType = '\(entityType)'"),
                trueExpression: NSExpression(forConstantValue: 1),
                falseExpression: NSExpression(forConstantValue: 0)
            )
        )
    })
])

// Import the geojson data and add it to the data source.
let url = URL(string: "https://samples.azuremaps.com/data/geojson/SamplePoiDataSet.json")!
source.importData(fromURL: url)

// Add data source to the map.
map.sources.add(source)

// Create a bubble layer for rendering clustered data points.
let clusterBubbleLayer = BubbleLayer(
    source: source,
    options: [
        .bubbleRadius(20),
        .bubbleColor(.purple),
        .bubbleStrokeWidth(0),

        // Only rendered data points which have a point_count property, which clusters do.
        .filter(from: NSPredicate(format: "point_count != NIL"))
    ]
)

// Add the clusterBubbleLayer to the map.
map.layers.addLayer(clusterBubbleLayer)

// Create a symbol layer to render the count of locations in a cluster.
map.layers.addLayer(
    SymbolLayer(
        source: source,
        options: [
            // Hide the icon image.
            .iconImage(nil),

            // Display the 'point_count_abbreviated' property value.
            .textField(from: NSExpression(forKeyPath: "point_count_abbreviated")),

            .textColor(.white),
            .textOffset(CGVector(dx: 0, dy: 0.4)),

            // Allow text overlapping so text is visible anyway
            .textAllowOverlap(true),

            // Only rendered data points which have a point_count property, which clusters do.
            .filter(from: NSPredicate(format: "point_count != NIL"))
        ]
    )
)

// Create a layer to render the individual locations.
map.layers.addLayer(
    SymbolLayer(
        source: source,
        options: [
            // Filter out clustered points from this layer.
            SymbolLayerOptions.filter(from: NSPredicate(format: "point_count = NIL"))
        ]
    )
)

// Add the delegate to handle taps on the clusterBubbleLayer only
// and display the aggregate details of the cluster.
map.events.addDelegate(self, for: [clusterBubbleLayer.id])
func azureMap(_ map: AzureMap, didTapOn features: [Feature]) {
    guard let popup = popup, let cluster = features.first else {
        // Popup has been released or no features provided
        return
    }

    // Create a number formatter that removes decimal places.
    let nf = NumberFormatter()
    nf.maximumFractionDigits = 0

    // Create the popup's content.
    var text = ""

    let pointCount = cluster.properties["point_count"] as! Int
    let pointCountString = nf.string(from: pointCount as NSNumber)!

    text.append("Cluster size: \(pointCountString) entities\n")

    entityTypes.forEach { entityType in
        text.append("\n")
        text.append("\(entityType): ")

        // Get the aggregated entity type count from the properties of the cluster by name.
        let aggregatedCount = cluster.properties[entityType] as! Int
        let aggregatedCountString = nf.string(from: aggregatedCount as NSNumber)!

        text.append(aggregatedCountString)
    }

    // Create the custom view for the popup.
    let customView = PopupTextView()

    // Set the text to the custom view.
    customView.setText(text)

    // Get the position of the cluster.
    let position = Math.positions(from: cluster).first!

    // Set the options on the popup.
    popup.setOptions([
        // Set the popups position.
        .position(position),

        // Set the anchor point of the popup content.
        .anchor(.bottom),

        // Set the content of the popup.
        .content(customView)
    ])

    // Open the popup.
    popup.open()
}
El elemento emergente sigue los pasos descritos en el documento Mostrar una ventana emergente.
En la imagen siguiente, el código anterior muestra una ventana emergente con recuentos agregados de cada tipo de valor de entidad para todos los puntos en el punto agrupado en clústeres en el que se ha pulsado.
Información adicional
Para agregar más datos al mapa: