Exercise - Forecast the impact of business practice changes on emissions
In this exercise, Jamie creates a scenario to forecast the impact of switching from combusting to recycling their mixed plastics. Jamie runs the scenario and views the forecast results.
Use an In-Private or Incognito window and open the Sustainability Environment.
Sign in with the credentials of Jamie Evans.
In the navigation pane, select Analytics > What-if analysis.
In the What-if analysis page, select New scenario.
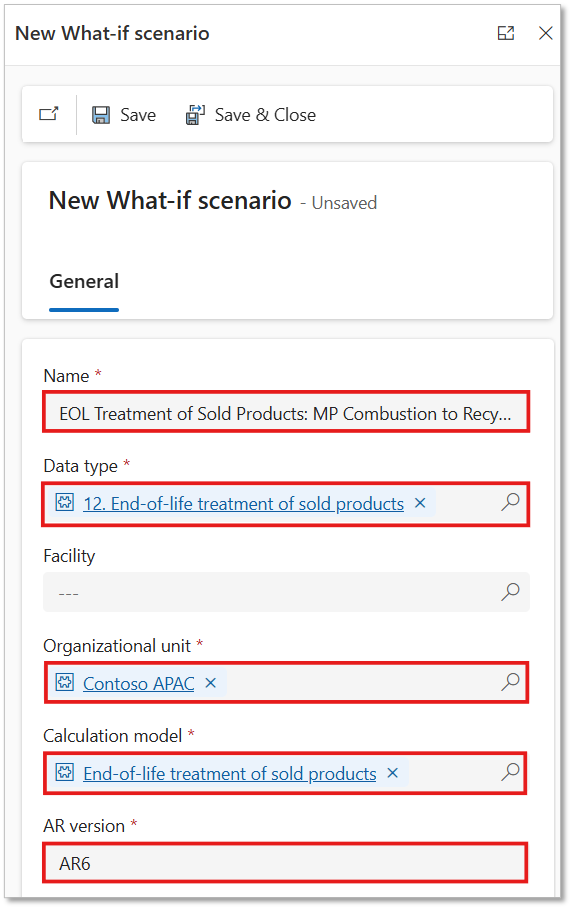
In the New What-if scenario pane, enter the following details:
Name – EOL Treatment of Sold Products: MP Combustion to Recycled
Data type – 12. End-of-life treatment of sold products
Organizational unit – Contoso APAC
Calculation model – End-of-life treatment of sold products
AR version – AR6
Select the number of strategies you want to layer by using the Number of strategies field. For this scenario, select 1 for Number of strategies.
Select the Variable(s) you want to forecast changes for, as part of your strategy or strategies. For this scenario, select the variables as Material and Disposal method.
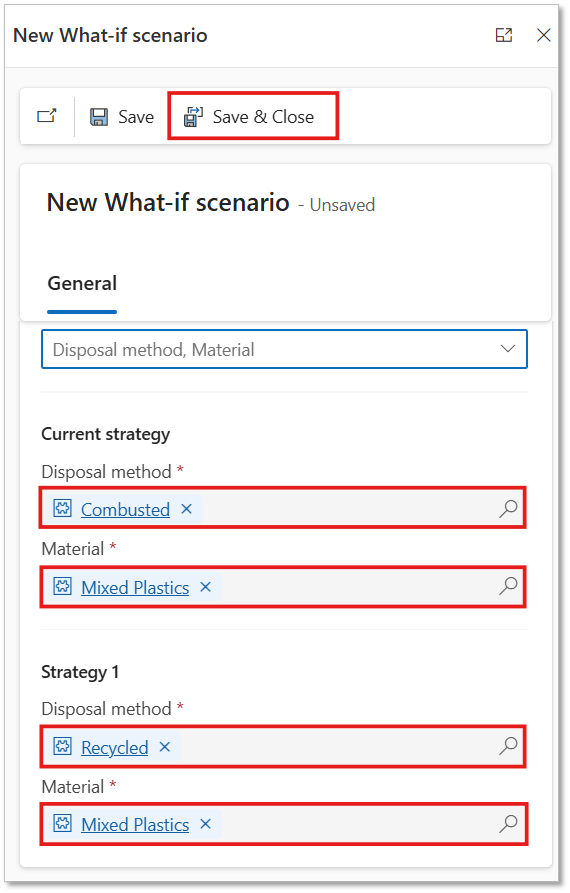
Select the current strategies as follows:
Strategy Value Disposal method Combusted Material Mixed Plastics Note
You first need to input the historical values for the Current strategy. These values represent the strategy your organization is currently employing.
Select the values for Strategy 1 as follows.
Strategy Value Disposal method Recycled Material Mixed Plastics After completing the form, select Save & Close.
Once the scenario is saved, select to open it.
Select Run scenario.
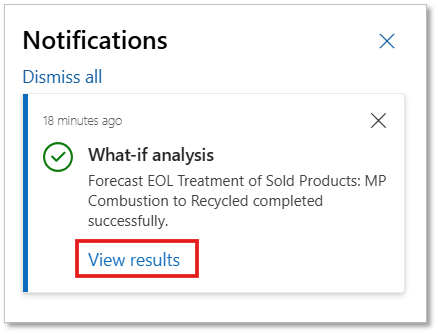
Once the scenario is created, you receive an in-app notification. This notification alerts you to the results and provide a hyperlink to access them. Select the notification and then select View results. You can also view the results from the Job history of your scenario.
Note
The what-if analysis forecasting models require at least six historical data points to successfully generate a forecast. For more information, see [Model failures and informational messages].
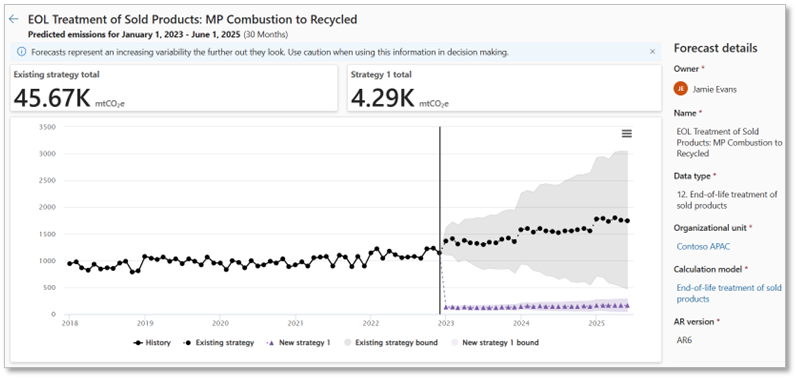
You're taken to the scenario details page and a graph visualizing your historic data and associated strategy forecasts.
Create a layered forecast
In this exercise, Jamie creates a multi-layered scenario for Mobile Combustion by creating multiple strategies, run the scenario and view the layered forecast results.
Use an In-Private or Incognito window and open the Sustainability Environment.
Sign in with the credentials of Jamie Evans.
In the navigation pane, select Analytics > What-if analysis.
In the What-if analysis page, select New scenario.
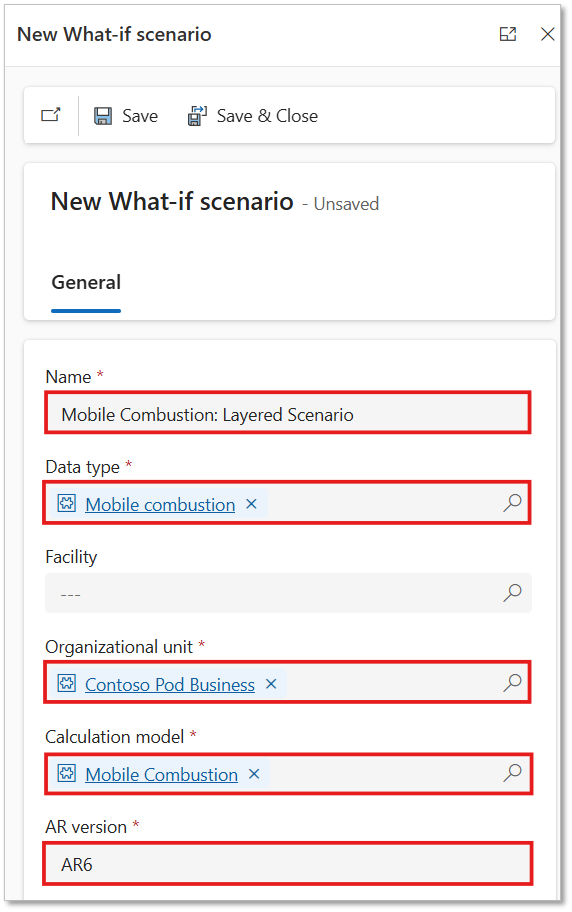
In the New What-if scenario pane, enter the following details:
Name – Mobile Combustion: Layered Scenario
Data type – Mobile combustion
Organizational unit – Contoso Pod Business
Calculation model – Mobile Combustion
AR version – AR6
Select 3 for Number of strategies.
Select the variables Fuel type and Vehicle type.
Select the Current strategies as follows.
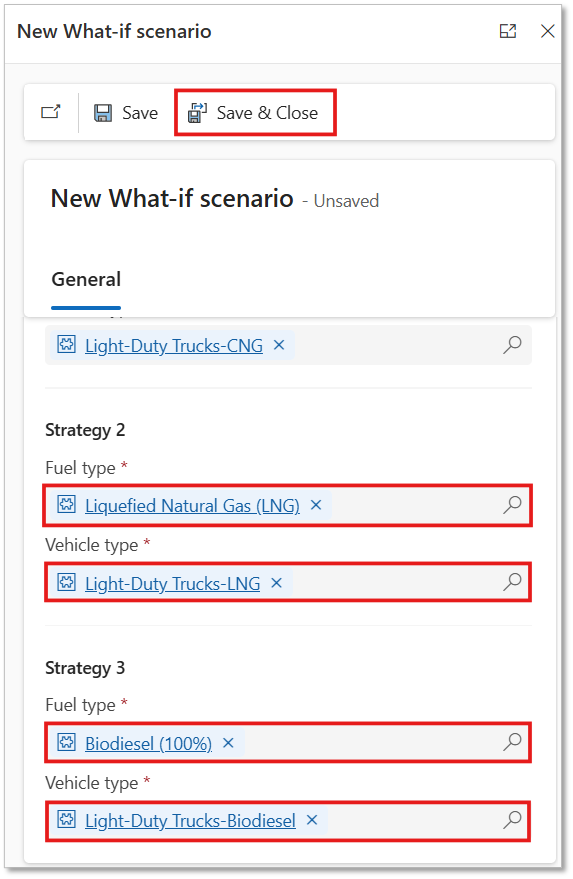
Strategy Value Fuel type Ethanol (100%) Vehicle type Light-Duty-Trucks-Ethanol Select the new strategies as follows.
Strategy Values Strategy 1 Fuel type Compressed Natural Gas (CNG) Vehicle type Light-Duty-Trucks-CNG Strategy 2 Fuel type Liquefied Natural Gas (LNG) Vehicle type Light-Duty-Trucks-LNG Strategy 3 Fuel type Biodiesel (100%) Vehicle type Light-Duty-Trucks-Biodiesel After completing the form, select Save & Close.
Once the scenario is saved, select to open it.
Select Run scenario.
Once the scenario is created, you receive an in-app notification. Select the notification and then select View results.
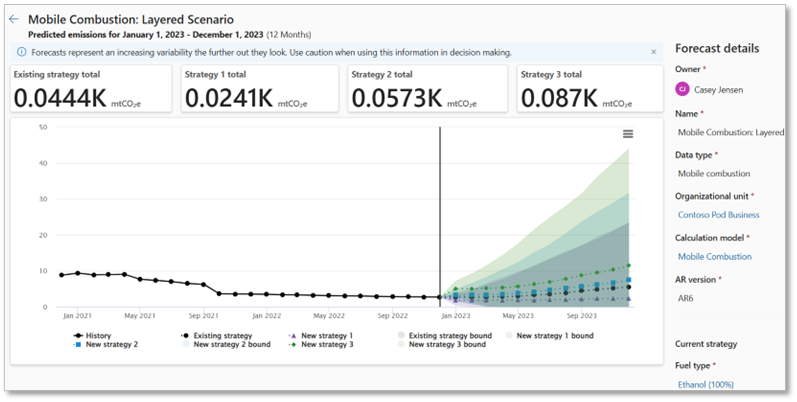
You're taken to the scenario details page and a graph visualizing your historic data and associated strategy forecasts.
Understanding your forecast
Existing strategy - The existing strategy forecast provides an insight into your projected emissions, assuming no changes are made to the current methods of emission generation for a specific category.
New strategy - The new strategy forecast provides a view into your projected emissions if you switch to the new business strategy represented by your forecast scenario.
Strategy bound - Strategy bounds represent the range of values that a forecast point might fall between 95% confidence interval. The recommendation is to carefully take these bounds into consideration during your decision-making process.
Cumulative emissions card - The Cumulative emissions cards on the result page represent the estimated cumulative emission that is generated because of the associated strategy used.
Horizon - The length of your scenario’s forecast horizon depends on the amount of historical data you provide. Generally, your forecast horizon is approximately half of your historical data. For instance, if you have two years of historical data at one-month intervals, you can expect a one-year forecast horizon at the same interval.
