Walkthrough: Using IntelliTrace
Note
This article applies to Visual Studio 2015. If you're looking for the latest Visual Studio documentation, see Visual Studio documentation. We recommend upgrading to the latest version of Visual Studio. Download it here
You can use IntelliTrace to collect information about specific events or categories of events, or about individual function calls in addition to events. The following procedures show how to do this.
You can use IntelliTrace in Visual Studio Enterprise edition (but not the Professional or Community editions).
Using IntelliTrace with events only
You can try debugging with just IntelliTrace events. IntelliTrace events are debugger events, exceptions, .NET Framework events, and other system events. You should turn on or turn off specific events to control the events that IntelliTrace records before you start debugging. For more information, see IntelliTrace Features.
The following steps show how to debug with IntelliTrace events only:
Turn on the IntelliTrace event for File Access. Go to the Tools / Options / IntelliTrace / IntelliTrace Events page, and expand the File category. Check the File event category. This causes all the file events (access, close, delete) to be checked.
Create a C# console application. In the Program.cs file, add the following
usingstatement:using System.IO;Create a FileStream in the Main method, read from it, close it, and delete the file. Add another line just to have a place to set a breakpoint:
static void Main(string[] args)
{
    FileStream fs = File.Create("WordSearchInputs.txt");
    fs.ReadByte();
    fs.Close();
    File.Delete("WordSearchInputs.txt");

    Console.WriteLine("done");
}
Set a breakpoint on
Console.WriteLine("done");Start debugging as usual. (Press F5 or click Debug / Start Debugging.
Tip
Keep the Locals and Autos windows open while you’re debugging to see and record the values in those windows.
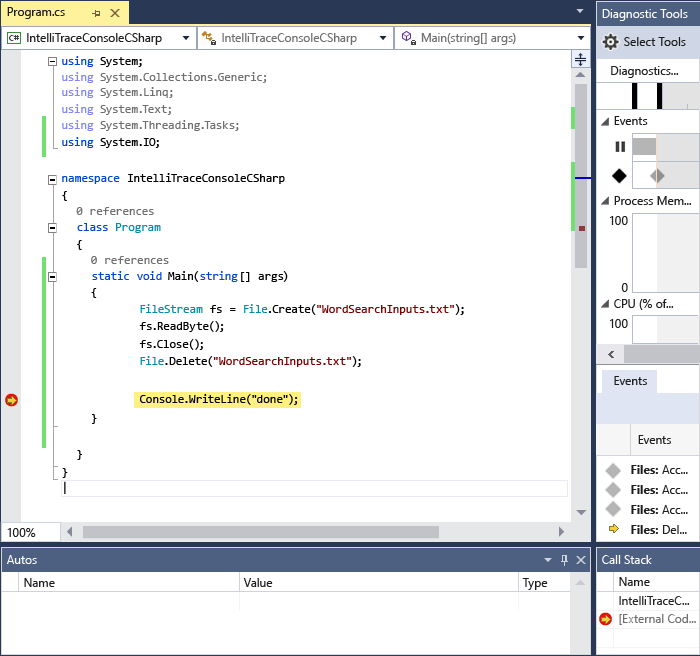
Execution stops at the breakpoint. If you do not see the Diagnostic Tools window, click Debug / Windows / IntelliTrace Events.
In the Diagnostic Tools window, find the Events tab (You should see 3 tabs, Events, Memory Usage, and CPU Usage). The Events tab shows a chronological list of events, ending with the last event before the debugger broke execution. You should see an event named Access WordSearchInputs.txt.
The following screenshot is from Visual Studio 2015 Update 1.

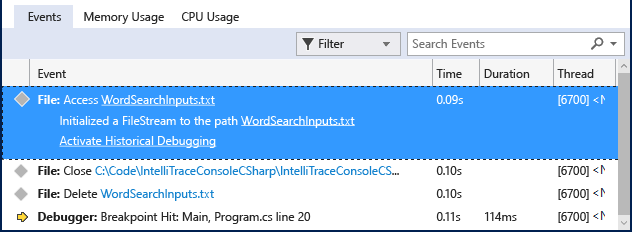
Select the event to expand its details.
The following screenshot is from Visual Studio 2015 Update 1.

You can choose the pathname link to open the file. If the full pathname is not available, the Open File dialog box appears.
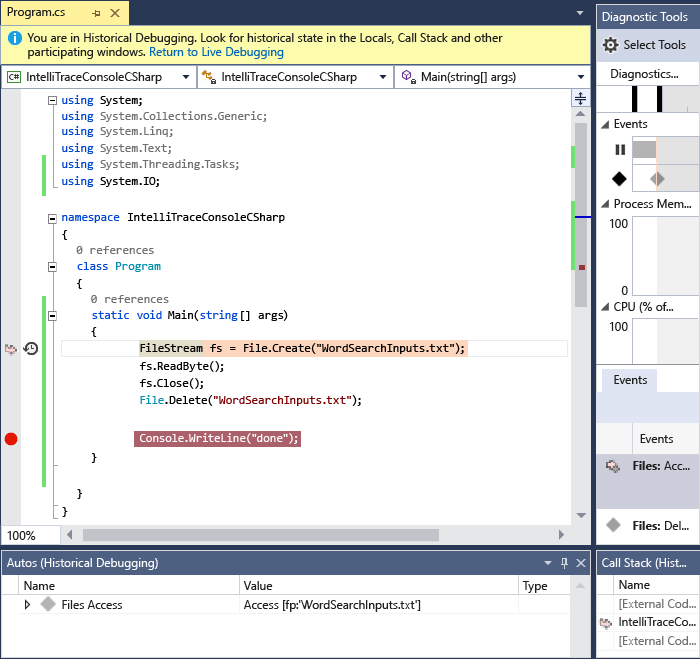
Click Activate Historical Debugging, which sets the debugger’s context to the time when the selected event was collected, showing historical data in the Call Stack, Locals and the other participating debugger windows. If source code is available, Visual Studio moves the pointer to the corresponding code in the source window so you can examine it.
The following screenshot is from Visual Studio 2015 Update 1.

If you didn't find the bug, try examining other events leading up to the bug. You can also have IntelliTrace record call information so you can step through function calls.
Using IntelliTrace with events and function calls
IntelliTrace can record function calls along with events. This lets you see the call stack history and step backward and forward through calls in your code. IntelliTrace records data such as function names, function entry and exit points, and certain parameter values and return values. See IntelliTrace Features.
Turn on call collection. (On Tools / Options / IntelliTrace / General, select IntelliTrace events and call information. IntelliTrace will start collecting this information when the next debugging session starts.
Tip
This might slow down your application and increase the size of any IntelliTrace log files (.iTrace files) that you're saving to disk. To get the most call data but minimize the effects, record data from only those modules that interest you. To change the maximum size of your .iTrace files, go to Tools / Options / IntelliTrace / Advanced, and specify the maximum amount of disk space. The default is 250 MB.
Start debugging the C# console application created in the previous section. Execution stops at the breakpoint. If you do not see the Diagnostic Tools window, click Debug / Windows / IntelliTrace Events.
Switch to the Calls tab.
Now you see your application's function calls, starting with the root call (in the current solution, the Main entry point) and ending with the location at which execution broke.
Select one of the function calls and double-click it. You should see the function entry and exit points, as well as the calls that the current call made to other functions and the IntelliTrace events raised by the call. If you do not have historical debugging turned on, this action turns it on. To find out more about historical debugging, see Historical Debugging.
Note
You may see that some calls are dimmed. This is because IntelliTrace didn't record data from the corresponding modules. To see this data, have IntelliTrace collect data from those modules. For information about specifying modules, see IntelliTrace Features.