Debug with Visual Studio
TFS 2017
Symbol servers enable debuggers to automatically retrieve the correct symbol files without knowing product names, build numbers or package names. These files contain useful information for the debugger and generally have the PDB extension. You can use Visual Studio to consume your symbols from Azure Artifacts symbol server or other external sources to step into your code and debug your application.
Add Azure Artifacts symbol server
To debug with symbols from the Azure Artifacts symbol server, we must authenticate to the server and add a new Azure DevOps Services symbol server to our Visual Studio environment.
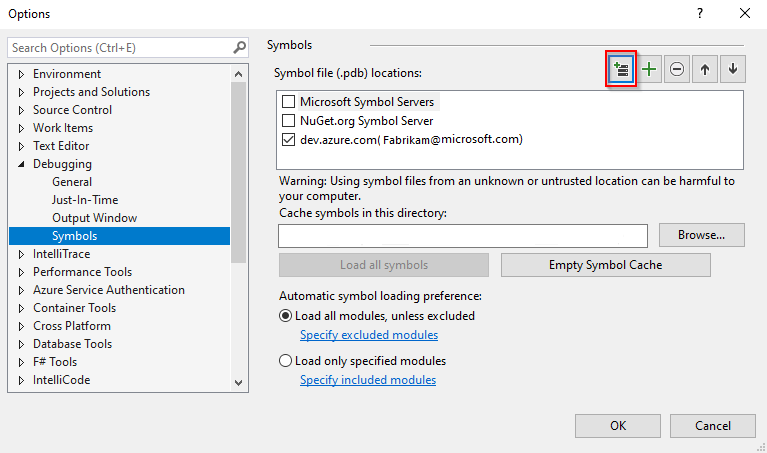
From Visual Studio, select Tools > Options > Debugging.
Select Symbols from the list, and then select the
+sign to add a new Azure DevOps symbol server location.
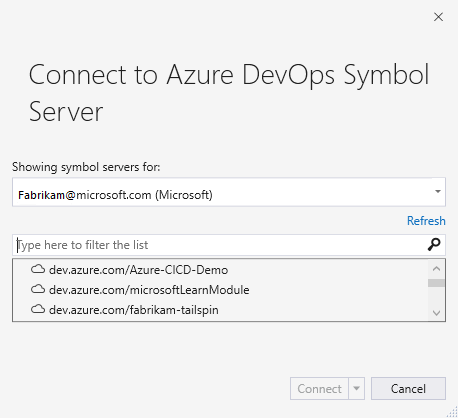
A new dialog box Connect to Azure DevOps Symbol Server will open, select your account from the dropdown menu, and then select the organization that you wish to connect to. Select Connect when you are done to connect to the symbol server.

Your symbol server is then added to the list of symbol file locations.

Debugging optimized modules
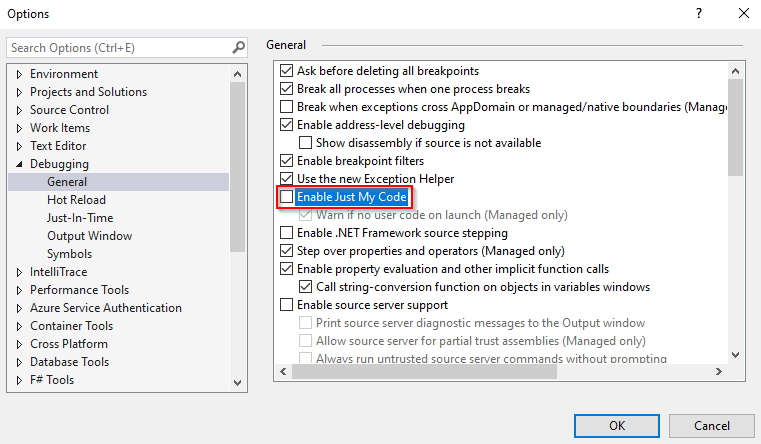
If you're planning to debug an optimized module (example release binaries) or a third-party source code, we recommend that you uncheck the Enable Just My Code checkbox in Visual Studio options.
To do so, select Tools > Options and then Debugging. Select General from the list and then uncheck Enable Just My Code.

Note
To enable support for portable PDB files, check the Enable Source Link Support checkbox from Tools > Options > Debugging > General.
To enable support for Windows PDB files on symbol servers, check the Enable Source Server Support checkbox from Tools > Options > Debugging > General.
Start debugging
You can start debugging your application in a few different ways:
- Press F5 to start the app with the debugger attached to the app process.
- Select Debug > Start Debugging.
- Select the Start Debugging button in the debug toolbar.
When you start the debugger, Visual Studio will attempt to load your symbols from the cache folder first before downloading them from the Artifacts symbol server that we added in the previous section.
Once Visual Studio finds and loads your symbols, you should be able to step through your code and debug your application. See Navigate through code with the Visual Studio debugger for more details.