Escenario de ejemplo de Scripts de Office: Captura y grafo de datos de nivel de agua de NOAA
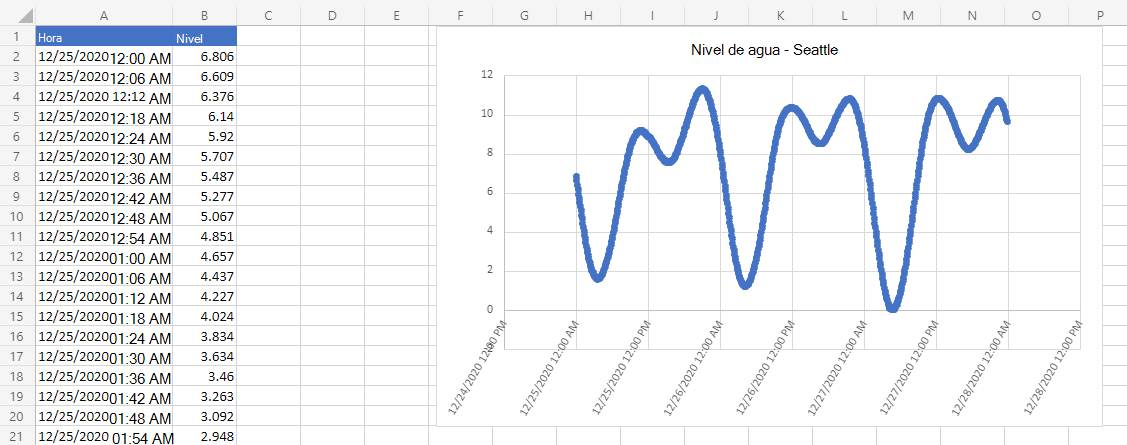
En este escenario, debe trazar el nivel del agua en la estación de Seattle de la Administración Nacional Oceánica y Atmosférica. Usará datos externos para rellenar una hoja de cálculo y crear un gráfico.
Desarrollará un script que use el fetch comando para consultar la base de datos Mareas y corrientes NOAA. Esto hará que el nivel de agua se registre en un intervalo de tiempo determinado. La información se devolverá como JSON, por lo que parte del script la traducirá en valores de intervalo. Una vez que los datos están en la hoja de cálculo, se usarán para crear un gráfico.
Para obtener más información sobre cómo trabajar con JSON, lea Uso de JSON para pasar datos hacia y desde scripts de Office.
Aptitudes de scripting cubiertas
- Llamadas API externas (
fetch) - Análisis de JSON
- Gráficos
Instrucciones de instalación
Abra el libro en Excel.
En la pestaña Automatizar , seleccione Nuevo script y pegue el siguiente script en el editor.
/**
 * Gets data from the National Oceanic and Atmospheric Administration's Tides and Currents database.
 * That data is used to make a chart.
 */
async function main(workbook: ExcelScript.Workbook) {
  // Get the current sheet.
  let currentSheet = workbook.getActiveWorksheet();

  // Create selection of parameters for the fetch URL.
  // More information on the NOAA APIs is found here:
  // https://api.tidesandcurrents.noaa.gov/api/prod/
  const option = "water_level";
  const startDate = "20201225"; /* yyyymmdd date format */
  const endDate = "20201227";
  const station = "9447130"; /* Seattle */

  // Construct the URL for the fetch call.
  const strQuery = `https://api.tidesandcurrents.noaa.gov/api/prod/datagetter?product=${option}&begin_date=${startDate}&end_date=${endDate}&datum=MLLW&station=${station}&units=english&time_zone=gmt&application=NOS.COOPS.TAC.WL&format=json`;

  console.log(strQuery);

  // Resolve the Promises returned by the fetch operation.
  const response = await fetch(strQuery);
  const rawJson: string = await response.json();

  // Translate the raw JSON into a usable state.
  const stringifiedJson = JSON.stringify(rawJson);

  // Note that we're only taking the data part of the JSON and excluding the metadata.
  const noaaData: NOAAData[] = JSON.parse(stringifiedJson).data;

  // Create table headers and format them to stand out.
  let headers = [["Time", "Level"]];
  let headerRange = currentSheet.getRange("A1:B1");
  headerRange.setValues(headers);
  headerRange.getFormat().getFill().setColor("#4472C4");
  headerRange.getFormat().getFont().setColor("white");

  // Insert all the data in rows from JSON.
  let noaaDataCount = noaaData.length;
  let dataToEnter = [[], []]
  for (let i = 0; i < noaaDataCount; i++) {
    let currentDataPiece = noaaData[i];
    dataToEnter[i] = [currentDataPiece.t, currentDataPiece.v];
  }

  let dataRange = currentSheet.getRange("A2:B" + String(noaaDataCount + 1)); /* +1 to account for the title row */
  dataRange.setValues(dataToEnter);

  // Format the "Time" column for timestamps.
  dataRange.getColumn(0).setNumberFormatLocal("[$-en-US]mm/dd/yyyy hh:mm AM/PM;@");

  // Create and format a chart with the level data.
  let chart = currentSheet.addChart(ExcelScript.ChartType.xyscatterSmooth, dataRange);
  chart.getTitle().setText("Water Level - Seattle");
  chart.setTop(0);
  chart.setLeft(300);
  chart.setWidth(500);
  chart.setHeight(300);
  chart.getAxes().getValueAxis().setShowDisplayUnitLabel(false);
  chart.getAxes().getCategoryAxis().setTextOrientation(60);
  chart.getLegend().setVisible(false);

  // Add a comment with the data attribution.
  currentSheet.addComment(
    "A1",
    `This data was taken from the National Oceanic and Atmospheric Administration's Tides and Currents database on ${new Date(Date.now())}.`
  );

  /**
   * An interface to wrap the parts of the JSON we need.
   * These properties must match the names used in the JSON.
   */
  interface NOAAData {
    t: string; // Time
    v: number; // Level
  }
}
Cambie el nombre del script a Gráfico de nivel de agua NOAA y guárdelo.
Ejecución del script
En cualquier hoja de cálculo, ejecute el script de gráfico de nivel de agua NOAA . El script captura los datos de nivel de agua del 25 de diciembre de 2020 al 27 de diciembre de 2020. Las const variables al principio del script se pueden cambiar para usar fechas diferentes u obtener información de estación diferente. La API de CO-OPS para la recuperación de datos describe cómo obtener todos estos datos.
Después de ejecutar el script
