Salida de datos de tabla de Excel como JSON para su uso en Power Automate
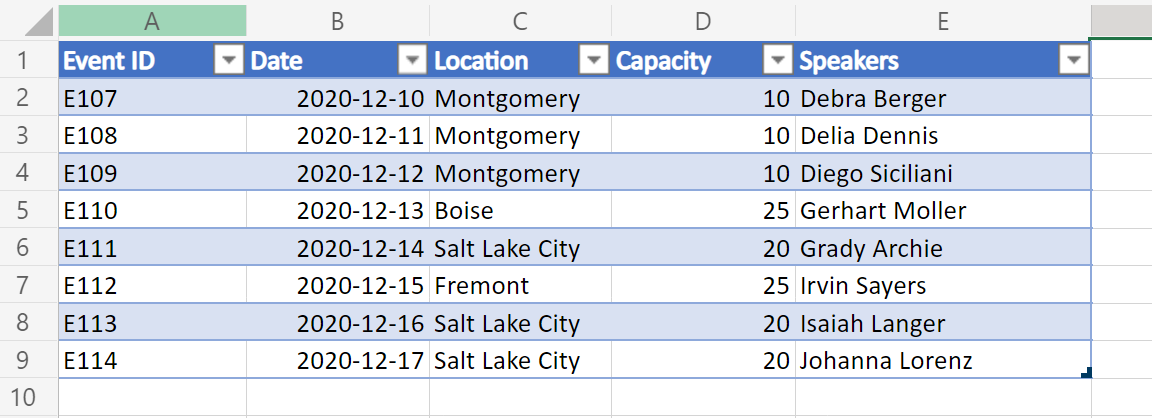
Los datos de la tabla de Excel se pueden representar como una matriz de objetos en forma de JSON. Cada objeto representa una fila de la tabla. Esto ayuda a extraer los datos de Excel en un formato coherente que sea visible para el usuario. A continuación, los datos se pueden proporcionar a otros sistemas a través de flujos de Power Automate.
Configuración: Archivo de Excel de ejemplo
Este libro contiene los datos, los objetos y el formato esperados por el script.

Una variación de este ejemplo también incluye los hipervínculos de una de las columnas de tabla. Esto permite que se exponen niveles adicionales de datos de celda en json.

Código de ejemplo: devolver datos de tabla como JSON
Agregue el siguiente script al libro de ejemplo y pruebe el ejemplo usted mismo.
Nota:
Puede cambiar la interface TableData estructura para que coincida con las columnas de tabla. Tenga en cuenta que para los nombres de columna con espacios, asegúrese de colocar la clave entre comillas, como con "Event ID" en el ejemplo. Para obtener más información sobre cómo trabajar con JSON, lea Uso de JSON para pasar datos hacia y desde scripts de Office.
function main(workbook: ExcelScript.Workbook): TableData[] {
  // Get the first table in the "PlainTable" worksheet.
  // If you know the table name, use `workbook.getTable('TableName')` instead.
  const table = workbook.getWorksheet('PlainTable').getTables()[0];

  // Get all the values from the table as text.
  const texts = table.getRange().getTexts();

  // Create an array of JSON objects that match the row structure.
  let returnObjects: TableData[] = [];
  if (table.getRowCount() > 0) {
    returnObjects = returnObjectFromValues(texts);
  }

  // Log the information and return it for a Power Automate flow.
  console.log(JSON.stringify(returnObjects));
  return returnObjects
}

// This function converts a 2D array of values into a generic JSON object.
// In this case, we have defined the TableData object, but any similar interface would work.
function returnObjectFromValues(values: string[][]): TableData[] {
  let objectArray: TableData[] = [];
  let objectKeys: string[] = [];
  for (let i = 0; i < values.length; i++) {
    if (i === 0) {
      objectKeys = values[i]
      continue;
    }

    let object: {[key: string]: string} = {}
    for (let j = 0; j < values[i].length; j++) {
      object[objectKeys[j]] = values[i][j]
    }

    objectArray.push(object as unknown as TableData);
  }

  return objectArray;
}

interface TableData {
  "Event ID": string
  Date: string
  Location: string
  Capacity: string
  Speakers: string
}
Salida de ejemplo de la hoja de cálculo "PlainTable"
[{
    "Event ID": "E107",
    "Date": "2020-12-10",
    "Location": "Montgomery",
    "Capacity": "10",
    "Speakers": "Debra Berger"
}, {
    "Event ID": "E108",
    "Date": "2020-12-11",
    "Location": "Montgomery",
    "Capacity": "10",
    "Speakers": "Delia Dennis"
}, {
    "Event ID": "E109",
    "Date": "2020-12-12",
    "Location": "Montgomery",
    "Capacity": "10",
    "Speakers": "Diego Siciliani"
}, {
    "Event ID": "E110",
    "Date": "2020-12-13",
    "Location": "Boise",
    "Capacity": "25",
    "Speakers": "Gerhart Moller"
}, {
    "Event ID": "E111",
    "Date": "2020-12-14",
    "Location": "Salt Lake City",
    "Capacity": "20",
    "Speakers": "Grady Archie"
}, {
    "Event ID": "E112",
    "Date": "2020-12-15",
    "Location": "Fremont",
    "Capacity": "25",
    "Speakers": "Irvin Sayers"
}, {
    "Event ID": "E113",
    "Date": "2020-12-16",
    "Location": "Salt Lake City",
    "Capacity": "20",
    "Speakers": "Isaiah Langer"
}, {
    "Event ID": "E114",
    "Date": "2020-12-17",
    "Location": "Salt Lake City",
    "Capacity": "20",
    "Speakers": "Johanna Lorenz"
}]
Código de ejemplo: devolver datos de tabla como JSON con texto de hipervínculo
Nota:
El script siempre extrae hipervínculos de la cuarta columna (índice 0) de la tabla. Puede cambiar ese orden o incluir varias columnas como datos de hipervínculo modificando el código en el comentario. // For the 4th column (0 index), extract the hyperlink and use that instead of text.
function main(workbook: ExcelScript.Workbook): TableData[] {
  // Get the first table in the "WithHyperLink" worksheet.
  // If you know the table name, use `workbook.getTable('TableName')` instead.
  const table = workbook.getWorksheet('WithHyperLink').getTables()[0];

  // Get all the values from the table as text.
  const range = table.getRange();

  // Create an array of JSON objects that match the row structure.
  let returnObjects: TableData[] = [];
  if (table.getRowCount() > 0) {
    returnObjects = returnObjectFromValues(range);
  }

  // Log the information and return it for a Power Automate flow.
  console.log(JSON.stringify(returnObjects));
  return returnObjects
}

function returnObjectFromValues(range: ExcelScript.Range): TableData[] {
  let values = range.getTexts();
  let objectArray : TableData[] = [];
  let objectKeys: string[] = [];
  for (let i = 0; i < values.length; i++) {
    if (i === 0) {
      objectKeys = values[i]
      continue;
    }

    let object = {}
    for (let j = 0; j < values[i].length; j++) {
      // For the 4th column (0 index), extract the hyperlink and use that instead of text.
      if (j === 4) {
        object[objectKeys[j]] = range.getCell(i, j).getHyperlink().address;
      } else {
        object[objectKeys[j]] = values[i][j];
      }
    }

    objectArray.push(object as TableData);
  }
  return objectArray;
}

interface TableData {
  "Event ID": string
  Date: string
  Location: string
  Capacity: string
  "Search link": string
  Speakers: string
}
Salida de ejemplo de la hoja de cálculo "WithHyperLink"
[{
    "Event ID": "E107",
    "Date": "2020-12-10",
    "Location": "Montgomery",
    "Capacity": "10",
    "Search link": "https://www.google.com/search?q=Montgomery",
    "Speakers": "Debra Berger"
}, {
    "Event ID": "E108",
    "Date": "2020-12-11",
    "Location": "Montgomery",
    "Capacity": "10",
    "Search link": "https://www.google.com/search?q=Montgomery",
    "Speakers": "Delia Dennis"
}, {
    "Event ID": "E109",
    "Date": "2020-12-12",
    "Location": "Montgomery",
    "Capacity": "10",
    "Search link": "https://www.google.com/search?q=Montgomery",
    "Speakers": "Diego Siciliani"
}, {
    "Event ID": "E110",
    "Date": "2020-12-13",
    "Location": "Boise",
    "Capacity": "25",
    "Search link": "https://www.google.com/search?q=Boise",
    "Speakers": "Gerhart Moller"
}, {
    "Event ID": "E111",
    "Date": "2020-12-14",
    "Location": "Salt Lake City",
    "Capacity": "20",
    "Search link": "https://www.google.com/search?q=salt+lake+city",
    "Speakers": "Grady Archie"
}, {
    "Event ID": "E112",
    "Date": "2020-12-15",
    "Location": "Fremont",
    "Capacity": "25",
    "Search link": "https://www.google.com/search?q=Fremont",
    "Speakers": "Irvin Sayers"
}, {
    "Event ID": "E113",
    "Date": "2020-12-16",
    "Location": "Salt Lake City",
    "Capacity": "20",
    "Search link": "https://www.google.com/search?q=salt+lake+city",
    "Speakers": "Isaiah Langer"
}, {
    "Event ID": "E114",
    "Date": "2020-12-17",
    "Location": "Salt Lake City",
    "Capacity": "20",
    "Search link": "https://www.google.com/search?q=salt+lake+city",
    "Speakers": "Johanna Lorenz"
}]
Uso en Power Automate
Para obtener información sobre cómo usar este tipo de script en Power Automate, consulte Creación de un flujo de trabajo automatizado con Power Automate.