Responsible AI FAQ for Analyze demand plans with Copilot
This FAQ provides answers to frequently asked questions about the AI technology that's used in the Analyze demand plans with Copilot feature for Demand planning in Microsoft Dynamics 365 Supply Chain Management. It includes key considerations and details about how the AI is used, how it was tested and evaluated, and any specific limitations.
What is Analyze demand plans with Copilot?
Demand planning in Supply Chain Management lets you use Copilot to analyze your demand plans. You can select from a set of predefined questions to analyze data for shifts, trends, anomalies, and accuracy. The results are delivered as a summary using natural language and visualizations.
By using Copilot, you can quickly gain valuable insights across multiple dimensions. You can use these insights to improve operational efficiency, increase profitability, and improve customer satisfaction.
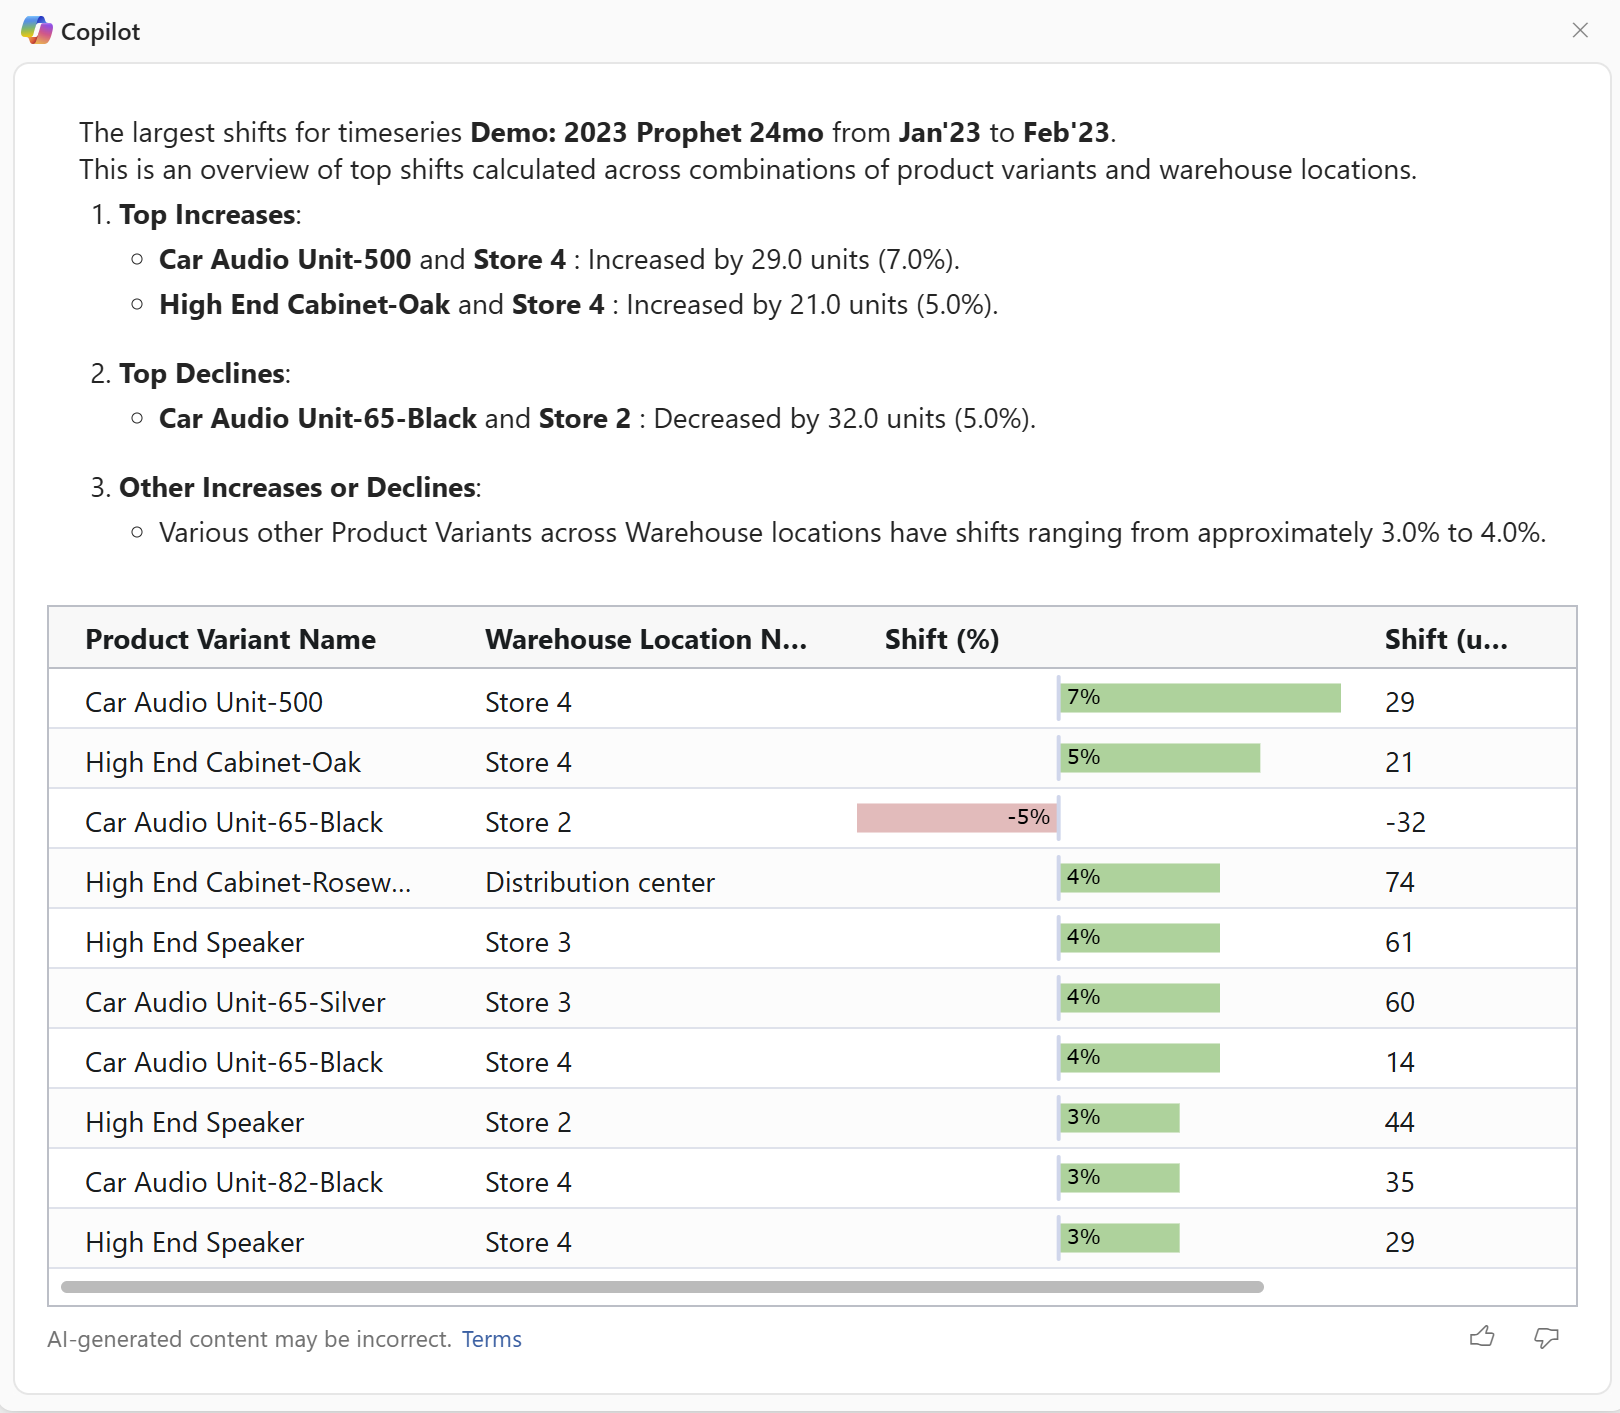
For example, a demand planner is interested in learning the most significant factors that contributed to a notable shift between two consecutive periods. The planner opens the relevant worksheet, selects a point of interest on the chart, and then selects a predefined question to ask Copilot. Copilot's response might resemble the following example.
What are the capabilities of Analyze demand plans with Copilot?
This feature lets users select from a set of predefined questions to analyze their multidimensional demand plans. The system queries the data in each dimension and for all dimensions. The results are delivered as a summary using natural language and visualizations.
Copilot respects all of the filters applied to the data set, so only the filtered data is analyzed. Increasing and decreasing results are highlighted when found.
Copilot allows you to analyze data for the following metrics:
- Shifts (Compares two consecutive periods of days, weeks, or months)
- Trends (Compares six consecutive periods of days, weeks, or months)
- Deviations (Compares two time series)
- Anomalies
What is the intended use of Analyze demand plans with Copilot?
Demand planners spend considerable time analyzing demand plans. This feature helps these users gain valuable insights into demand plans. It helps them make informed decisions by providing a single result that summarizes the most significant shifts, trends, anomalies, or accuracies that occurred across several dimensions. Planners can then adjust their plans based on the detected results.
How was Analyze demand plans with Copilot evaluated? What metrics are used to measure performance?
The system underwent substantial testing before it was released. It relies on user feedback to report inappropriate content.
If you encounter inappropriate generated content, report it to Microsoft by using this feedback form: Report abuse. Your feedback helps improve the functionality.
Microsoft might disable Copilot-driven features for selected customers if abuse of the functionality is detected.
What are the limitations of Analyze demand plans with Copilot? How can users minimize the impact of these limitations when they use the system?
Copilot shows a maximum of ten results. These results are ordered by significance. Results of equal significance are ordered arbitrarily. Although there might be additional results that have the same significance as the tenth result, Copilot doesn't indicate that those results exist.
The AI-generated results are always presented in US English.
AI-generated content should not be used without manual review or supervision.
What operational factors and settings allow for effective and responsible use of Analyze demand plans with Copilot?
When you use this feature, follow these recommendations:
- Make sure that your company has enough control over data permissions to ensure that business data can't be manipulated to influence AI data processing in an undesirable way.
- Before you make decisions about modifications to the demand plan, always review and study the generated response, and compare it with actual demand plan data.
