Performance
Find Application Bottlenecks with Visual Studio Profiler
Hari Pulapaka and Boris Vidolov
This article discusses:
|
This article uses the following technologies: Visual Studio 2008 |
Contents
Application Profiling
Optimizing the Application
Targeted Profiling
The past decade has brought us many new software technologies and platforms. Each of these new technologies requires special knowledge to create great-performing applications. As Internet technologies like blogs have now enabled frustrated users to easily cast a negative light on your applications, you really need to make performance a primary priority. Early in planning, you should add requirements for responsiveness and create prototypes to identify possible technology restrictions. Throughout development, you should also measure different performance aspects of the application to find possible regression, and ensure that testers file and track bugs for slow scenarios.
Even with best planning, you may still have to investigate performance problems during product development. In this article, we will show you how you can use Visual Studio® Team System Development Edition or Visual Studio Team Suite to identify performance bottlenecks in your application. We'll introduce you to the Visual Studio Profiler by walking through a sample performance investigation. Please note that while we used C# to write the code samples in this article, most of the examples here are equally valid for native C/C++ and Visual Basic® code as well.
Application Profiling
For our purpose, we'll use the profiler that comes with the two previously mentioned editions of Visual Studio. We will start with a small sample project that draws a Mandelbrot fractal as shown in Figure 1. This application is not very efficient and it takes approximately 10 seconds to draw the fractal.
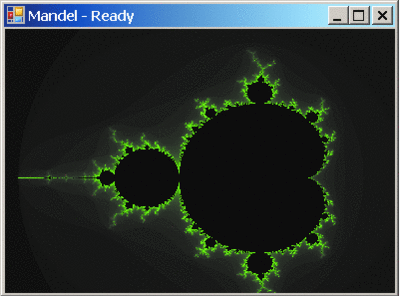
Figure 1** Target Program for Performance Testing **(Click the image for a larger view)
To start our investigation, we launch the Performance Wizard from the new Analyze menu in Visual Studio 2008. In Visual Studio 2005 this functionality is available from the Tools | Performance Tools menu. This launches a three-step wizard, where the first step lets us specify the target project or Web site. The second step provides two different profiling methods: sampling and instrumentation. (See the "Performance Profiling Explained" sidebar for details on these profiling methods.) For now, we will pick the defaults.
After the wizard completes, a Performance Explorer dialog is displayed and a new performance session is created. The session contains the target application, Mandel in our case, and no reports. To start profiling we click the Launch with Profiling button in the tool window toolbar.
After the application draws the fractal, we immediately close the form to stop profiling. Visual Studio automatically adds a newly created report to our performance session and starts analyzing it. When the analysis completes, Visual Studio Profiler displays the Performance Report Summary, which lists the most expensive functions (see Figure 2). The report shows these functions in two ways. The first measures the work performed directly or indirectly by listed functions. For each function, the numbers represent the accumulated samples collected in both the body of the function and in all of its child calls. The second list does not count the samples collected in child calls. The summary page shows that Visual Studio Profiler collected 30.71 percent of the samples during execution of the DrawMandel method. The remaining 69 percent of the samples are scattered among different functions and not shown here. To learn more about the options for reporting, see the sidebar "Report Visualization Options."
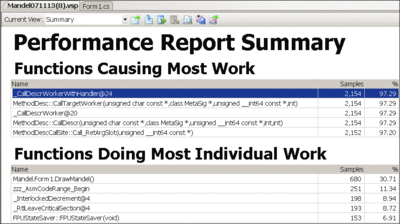
Figure 2** Performance Test Shows Expensive Function Calls **(Click the image for a larger view)
Looking at the Call Tree view of the report, shown in Figure 3, the Inclusive Samples % column represents the samples collected in the function and its children. The Exclusive Samples % column represents samples collected in the body of the function only. You can see that the DrawMandel method directly calls Bitmap.SetPixel. While DrawMandel itself caused 30.71 percent of the total samples, Visual Studio Profiler collected 64.54 percent from Bitmap.SetPixel and its children. The body of Bitmap.SetPixel caused only 0.68 percent and this is why it did not show up on the summary page. Yet, Bitmap.SetPixel caused most of the processing through its children. This is the real bottleneck of the application.

Figure 3** Call Tree Samples for the Tested Application **(Click the image for a larger view)
Obviously, Bitmap.SetPixel is not optimal for the purposes of the Mandel project. Our application needs a faster way to access all the pixels on the form. Luckily for us, the Bitmap class provides yet another useful API: Bitmap.LockBits. This function allows the program to write directly into the bitmap memory, thus reducing the overhead of setting individual pixels. Furthermore, to optimize the drawing, we will create a flat integer array and fill it with the color values of each pixel. Following that, we will copy the values of that array into the bitmap in one single operation.
Optimizing the Application
Performance Profiling Explained
When profiling using the sampling method, the profiler attaches to the running process in a way similar to the debugger. Then the profiler periodically interrupts the process and inspects which function is on the top of the stack, along with the code path that led to the function. In other words, Visual Studio Profiler collects a sample of the current process state. Sampling is a nonintrusive, statistical approach to profiling. The more samples collected in a function, the more processing the function has likely performed.
Visual Studio Profiler also collects information about the call path that led to this execution. Thus, the tool is able to display the full call stack after analyzing the collected data. By default, Visual Studio Profiler collects one sample every 10 million CPU cycles. In addition to CPU cycles, sampling can occur on many other events like page faults, system calls, CPU cache misses, and so on. The properties of the profiling session control what the profiler samples on and how often.
As a low overhead solution, sampling is often the recommended option. It is important to note, however, that sampling collects information only when the program actively uses the CPU. Thus, while your process is waiting for disk, network, or any other resource, Visual Studio Profiler does not collect samples. This is why, if your application does not actively use the CPU, we recommend using instrumentation profiling.
In instrumentation mode, Visual Studio Profiler modifies (instruments) the binaries by injecting special instructions (called probes) at the beginning and at the end of each function. The probes allow the profiler to measure how long it takes to run each function. Additionally, the profiler also adds a pair of probes around each external function call, enabling it to determine how expensive those external calls are.
With instrumentation profiling you can measure data such as exactly how long the function took to run (Elapsed Time), how many times it was called, and even how long the function was actively using the CPU (Application Time) and not switched out by the OS. The drawback of instrumentation is that it collects large amounts of data that takes longer to analyze. In addition, this profiling mode also has higher runtime overhead. The higher overhead may inadvertently change the performance characteristics of your application being profiled.
With both sampling and instrumentation, you can also collect memory allocation data for applications based on the Microsoft® .NET Framework. Users could enable and tune the collection of .NET memory allocation data using the performance session property pages. This is often referred to as memory profiling, and there is an extensive MSDN® documentation on that topic. Note that this is the only feature in the Profiler that is only available for .NET Framework-compliant code. For the rest of the features, Visual Studio Profiler has complete parity between native C/C++ and .NET-based applications.
Let's modify the DrawMandel method to use LockBits instead of SetPixel and see what kind of performance we gain with that change. After creating the bitmap, add the following lines to lock the bitmap bits and obtain a pointer to bitmap memory:
BitmapData bmpData =
    bitmap.LockBits(
        new Rectangle(0, 0, Width, Height),
        ImageLockMode.ReadWrite,
        bitmap.PixelFormat);
IntPtr ptr = bmpData.Scan0;
int pixels = bitmap.Width * bitmap.Height;
Int32[] rgbValues = new Int32[pixels];
Then, in the inner loop where we set the pixels, comment out the call to Bitmap.SetPixel and replace it with a new statement like the following:
//bitmap.SetPixel(column, row, colors[color]);
rgbValues[row * Width + column] =
    colors[color].ToArgb();
In addition, add the following lines to copy the array into the bitmap memory:
Marshal.Copy(rgbValues, 0, ptr, pixels);
bitmap.UnlockBits(bmpData);
Now, if we rerun the application under the profiler, we can see that the fractal draws nearly three times faster (see Figure 4). Note that the summary page of the new performance report shows that body of DrawMandel directly causes 83.66 percent of the total samples. Since we optimized the drawing, the bottleneck is now in the calculation of the fractal.

Figure 4** Performance Profile for the Revised Code **(Click the image for a larger view)
We will now go one step further and optimize that calculation, too. Unfortunately, this time we will need to find the bottleneck in a single function. DrawMandel is a complex method making it difficult to know which calculations to focus on. Luckily, the Visual Studio 2008 sampling profiler also collects line-level data by default, which will help identify which lines within a function are most expensive.
To view line-level data, let's inspect the performance report from another point of view. From the Current View menu, switch to the Modules view. Unlike the Call Tree view, the Modules view does not show information on how functions call each other and how much those calls cost in the context of the parent function. Instead, the Modules view contains the total accumulated samples per executable (assembly or DLL) and per function in that executable. Visual Studio Profiler accumulates that data from all call stacks.
The Modules view is good for observing the bigger picture. For instance, if we sort by the Exclusive Samples % column, we can see that Mandel.exe performs 87.57 percent of the processing itself. As result of our optimizations, GDI+ is responsible for less than 3 percent. Expanding these modules, we can see the same information for individual methods. Additionally, in Visual Studio 2008 we have the ability to expand the tree beyond function level and see the same data for the individual lines or even individual instructions in those lines (see Figure 5).
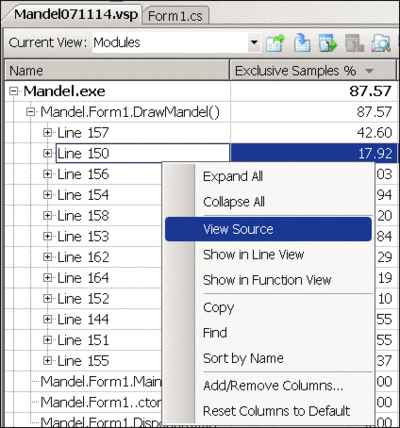
Figure 5** Jump to Profiled Line of Code **(Click the image for a larger view)
Jumping to the source uncovers the code shown in Figure 6. The code calculates the square root inside the inner most loop condition. This operation is expensive and is responsible for 18 percent of total application processing. The highlighted lines in Figure 6 show the code we can optimize. The first line uses an unnecessary square root, and the second is invariant for the while loop.
Figure 6 Code-Level Optimizations
Original Code
for (int column = 1; column < Width; column++)
{
 y = yStart;
 for (int row = 1; row < Height; row++)
 {
  double x1 = 0;
  double y1 = 0;
  int color = 0;
  int dept = 0;
  while (dept < 100 && Math.Sqrt((x1 * x1) + (y1 * y1)) < 2)
  {
   dept++;
   double temp = (x1 * x1) - (y1 * y1) + x;
   y1 = 2 * x1 * y1 + y;
   x1 = temp;
   double percentFactor = dept / (100.0);
   color = ((int)(percentFactor * 255));
  }
  //Comment this line to avoid calling Bitmap.SetPixel:
  //bitmap.SetPixel(column, row, colors[color]);
  //Uncomment the block below to avoid Bitmap.SetPixel:
  rgbValues[row * Width + column] = colors[color].ToArgb();

  y += deltaY;
 }
 x += deltaX;
}
Optimized Code
for (int column = 1; column < this.Width; ++column)
{
 y = yStart;
 int index = column;
 for (int row = 1; row < Height; row++)
 {
  double x1 = 0;
  double y1 = 0;
  int dept = 0;
  double x1Sqr, y1Sqr;
  while (dept < 100 && ((x1Sqr = x1 * x1) + (y1Sqr = y1 * y1)) < 4)
  {
   dept++;
   double temp = x1Sqr - y1Sqr + x;
   y1 = 2 * x1 * y1 + y;
   x1 = temp;
  }
  rgbValues[index] = colors[((int)(dept * 2.55))].ToArgb();
  index += Width;

  y += deltaY;
 }
 x += deltaX;
}
With that fix in, let's re-profile the application and check the performance of our optimized code. After building and running the app, the fractal now redraws in 1-2 seconds. We have reduced the startup time of the application noticeably.
Visual Studio 2008 includes a new feature that allows you to compare two performance reports. To see this feature in action, we rerun the application under the profiler and capture the latest performance report. To see the difference between the two versions of the application, select the original and the latest report in the Performance Explorer. Right-click on the report and from the context menu, click the Compare Performance Reports option. The command brings up a new report showing a flat view of all functions and the difference between the respective Exclusive Samples % value for that function in both reports. Because we cut the total execution time, DrawMandel's relative percent has raised from 31.76 to 70.46.
To better view the actual optimization, in the comparison options pane we will change the column to Inclusive Samples (see Figure 7). We also increase the threshold to 1500 samples, so that we do not see any minor fluctuations. In addition, you may note that, by default, the report shows the negative data, or least optimized functions first, as it is often used for finding regressions. For the purpose of our optimization, however, we will reverse sort the Delta column, so that we can see the most optimized functions on the top. Note that DrawMandel and its children changed from 2,064 samples to 175. This is more than tenfold optimization! To show off the performance improvements made, you can copy and paste any portion of that report.
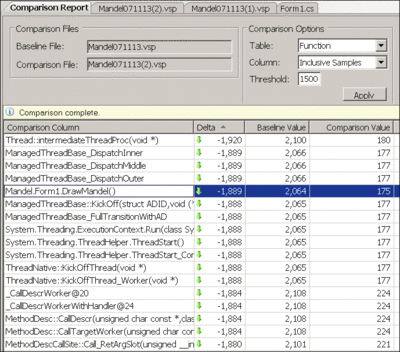
Figure 7** Comparing Optimization Results for DrawMandel **(Click the image for a larger view)
Targeted Profiling
Report Visualization Options
Visual Studio can view the performance data in different ways, using various performance report options: Call Tree, Modules, Functions, and several others. Summary is the default view when the report opens. For example, to locate the call path that caused most of the processing in Visual Studio 2008 select the Call Tree view from the Current View menu. (In Visual Studio 2005, select the Call Tree tab at the bottom of the report.) The Call Tree view contains the aggregated tree of all call stacks. The Inclusive Samples % column shows the aggregated expense of each branch in those code paths. By following the most expensive branches, you can find the performance bottleneck.
In Visual Studio 2008, the profiler team added two new features to simplify the usage of performance reports. The first is the addition of noise reduction options. By default, the reports now trim insignificant small functions, thus allowing users to see the ones with bigger impact easily. This option is often referred to as trimming. In addition, the team reduced the depth of the call trees by stacking together functions that do not have any processing on their own and just call other functions to do the processing. Visual Studio Profiler refers to this as folding.
The noise reduction options in the performance report control the threshold values for trimming and folding. You can turn off noise reduction if you experience problems finding a specific function in your performance report.
The second big improvement to call trees in Visual Studio 2008 is the Hot Path button and respective context menu. Hot Path highlights the most expensive code path in the program and follows this path until it sees significant processing performed (and not delegated) by a single function. Hot Path then highlights that function. If there are two or more separate important code paths, Hot Path will stop at the point in the tree where the branching occurs. If Hot Path provides more than one branch for your application, you could choose the more interesting one and reapply Hot Path for that particular branch.
So far, we have demonstrated how to use the Visual Studio Profiler for improving the performance of an application. But many real-world apps require that you go through multiple user actions to get to the performance problem. Typically, you would prefer to disregard any data collected prior to the start of your scenario. In addition, you may want to collect data from multiple scenarios in a single run.
To demonstrate how to use the profiler for such cases, we will switch gears and profile a sample e-commerce Web site (in fact, we used a modified version of TheBeerHouse sample available from asp.net/downloads/starter-kits/the-beer-house). This Web site takes a long time to load, but since that is a one-time cost, we're not as interested in startup time as we are in why the product catalog takes a long time to load and why adding an item to the shopping cart is so slow.
For the purpose of this article, we will show you the investigation of the first scenario only. We will, however, collect data for both scenarios and show you how to filter that data to focus on the performance problems of a specific scenario.
First, we create a new profiling session. As before, launch the Performance Wizard through the Analyze menu, then choose the defaults through the pages of the wizard. Note that for Web sites, Instrumentation Profiling is the default option. Web sites are often not CPU-bound; they usually rely on database server applications to do the heavy lifting. Thus, instrumentation is a better choice.
After creating the performance session, we launch the Web site under the profiler, but we will avoid the start-up time and focus on one scenario at a time. To do this in Visual Studio 2008, under the Performance Explorer, we can use the Launch with Profiling Paused option to start the application with Visual Studio Profiler attached, but the profiler will not collect any data until the user resumes profiling (see Figure 8).
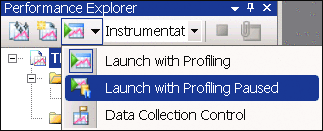
Figure 8** Pausing the Profiler at Launch **
As the Web site is loading, we switch back to Visual Studio. Note that Visual Studio Profiler shows a new tool window called Data Collection Control. This window allows you to pause and resume collection multiple times. An important part of that control is the list of predefined marks. Those are bookmarks or labels that you can insert into profiling data to denote interesting points of time. We use these marks to delimit the beginning and end of each user scenario.
First, we'll rename four of those marks using the Rename Mark command in the context menu. We will also remove unused marks (see Figure 9). So far, we have kept profiling paused to avoid start up time collection and prepare our scenarios. After the Web site loads, we will resume profiling.
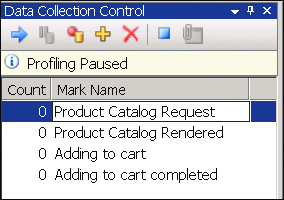
Figure 9** Naming Profile Marks for Test Scenarios **
We are ready to start our first scenario. We'll mark the beginning of that scenario by selecting the Product Catalog Request mark and clicking the Insert Mark button. We then switch back to Internet Explorer® and complete the first scenario by showing the product catalog. After the Web site displays it, we insert the Product Catalog Rendered mark, denoting the end of this scenario. To transition to the next scenario, we select the Beer cap product. Again, we insert the respective marks before and after the addition. As this completes all of our scenarios, we then exit the application.
After analysis of the data completes, Visual Studio Profiler presents the Performance Report Summary. This report is slightly different from the sampling report as it shows the most called functions, as well as the duration of the functions taking the longest. It is important to note that this data is aggregated over the lifetime of the application and includes both of our scenarios and any preceding activities.
Obviously, we would like to have the performance report show us only the data for a given scenario and filter out the rest. In Visual Studio 2008, the profiler has a new Marks view that lists all inserted marks. (Note that Visual Studio Profiler inserts additional automatic marks at the beginning and end of program.) To create a filter for our first scenario, we select the marks denoting the beginning and end of that scenario and select Add Filter on Marks in the context menu. This automatically creates the needed filter (see Figure 10). Besides marks, we could also filter by Thread, Process, or time interval. As we have our filter setup, we can go ahead and execute it.
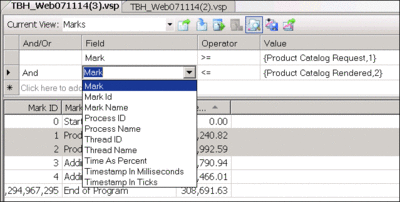
Figure 10** Target Program for Performance Testing **(Click the image for a larger view)
Note that this filtering applies to all views in the performance report. This is why Visual Studio Profiler automatically shows up the new summary page for the filtered data. This summary page is specific to the product catalog rendering scenario. For instance, we could see that System.IDisposable.Dispose is taking 3.4 seconds or 61 percent of the scenario execution time, while before it was responsible for 41 percent. Through filtering, we were able to see exactly how important this function is for our particular problem.
Now we'll fix this performance issue. We need to find the function in our code that caused those object disposals. The easiest way is to use the Call Tree with the Hot Path feature, as shown in Figure 11. This immediately shows that the SetInputControlsHighlight function is causing most of the calls to IDisposable.Dispose.
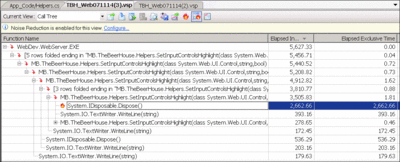
Figure 11** Finding the Problem Using Hot Path **(Click the image for a larger view)
It turns out that the function contains an inefficient logging mechanism:
foreach (Control ctl in container.Controls) {
  log += "Setting up control: " + ctl.ClientID;
  string tempDir =
    Environment.GetFolderPath(Environment.SpecialFolder.MyDocuments);
  using (StreamWriter sw = new StreamWriter(
    Path.Combine(tempDir, "WebSite.log"), true)) {
    sw.WriteLine(log);
  }
 ...
This is extensive logging left by mistake during debugging and does not serve any specific diagnostic purpose anymore so it is safe to remove it. Again, the Hot Path feature in Visual Studio 2008 allowed us to quickly identify the bottleneck in our app.
Whether you write your applications in native C/C++, C#, or Visual Basic, Visual Studio Profiler significantly simplifies performance investigations and helps you write faster and more efficient applications. Visual Studio 2008 brings additional improvements to Visual Studio Profiler, making it easier than ever to find the performance bottlenecks in your programs.
Hari Pulapaka is a Software Design Engineer in Test who works on the Visual Studio Profiler team at Microsoft.
Boris Vidolov is a Program Manager at Microsoft. In his more than 10 years in the software industry, he has worked on many performance-critical applications. You can learn more about Boris at his personal blog, perfcop.spaces.live.com.