Getting better stack traces in Process Monitor / Process Explorer
Process Monitor and Process Explorer are great tools for troubleshooting issues on Windows machines. Process Explorer can be used to investigate a running process from handles to dlls loaded. Process Monitor is my favourate and it can be used to monitor file system / registry activity on a machine. It logs all access to the file system / registry by all processes on the machine (can be filtered).
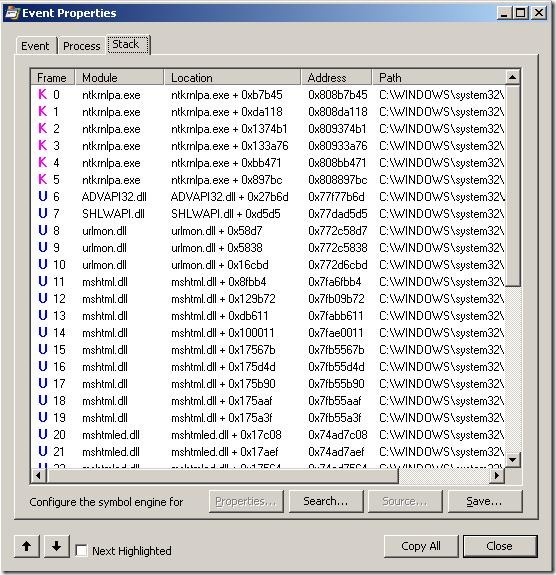
Process Monitor also shows you the call stack of the thread that lead to the file system / registry access.
The call stack in the above image is not very helpful as it is only showing the offset addresses(under Location). Not a lot of people realize that in both Process Monitor and Process Explorer you can configure a symbol server. You can point to the public Microsoft Symbol Server at https://msdl.microsoft.com/download/symbols and Process Monitor / Process Explorer will download the necessary symbol files and show you a better call stack with all the function names instead of the address offsets.
But to enable Process Monitor / Process Explorer to talk to the Microsoft Symbol Server you need to install WinDbg (Microsoft Debugging Tools For Windows) on the machine. You need this because the dbghelp.dll has to upgraded to enable it to connect to a symbol server.
Once you install WinDbg in Process Monitor go to Options > Configure Symbols and configure the dbghelp.dll and the symbol server path.
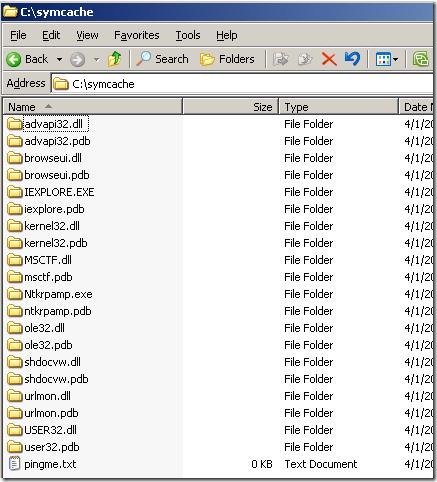
So here I have configured the dbghelp.dll path to point to the location where my windbg is installed. The Symbols path is pointing to the Microsoft Symbol Server … It specifies c:\symcache as the location where it can cache the symbol files it downloads.
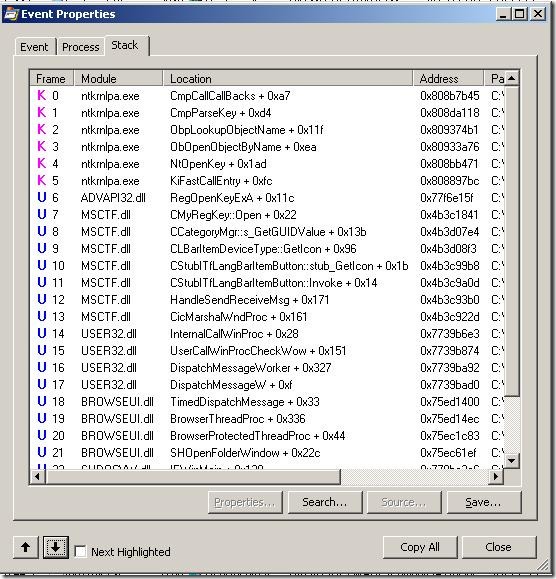
Now if you go back into Process Monitor / Process Explorer and check the call stack it will look something like this.
Now you get proper function names as per the public microsoft symbols. In the symcache folders you will see all the symbols that got downloaded.
Now this is not limited to just Microsoft symbols. If you have symbols created for your application components you can include those as well and get the function names in the call stack.
Comments
Anonymous
April 01, 2009
Miles to go before you sleep...;-) good job!Anonymous
August 17, 2009
Thanks for your detailed information. But I have a question. Sometimes, the callstack is not deep enough. Is there any way to adjust the callstack depth? Thanks for your reply in advance :DAnonymous
December 03, 2009
Precicely the information I was looking for... thank you!Anonymous
February 14, 2011
Great tip. Thanks for making a confusing subject easy.Anonymous
July 04, 2011
Nice. Is it possible to display the call stack of the methods/functions from the .NET managed code?Anonymous
May 13, 2013
Thank you for the advice, my site Liverpool Escorts is working a whole lot better. <a href="http://www.bestinsurancecalculator.com">best insurance calculator - your insurance guide</a>


