Monitoring AlwaysOn Health with PowerShell - Part 1: Basic Cmdlet Overview
Introduction
The AlwaysOn Dashboard is a very useful tool for determining the overall health of your AlwaysOn Availability Groups (AG). However, the purpose of this tool is not 24x7 monitoring. If your application encounters a critical error in the middle of the night, the Dashboard won’t wake you up.
To facilitate this alerting scenario, we’ve exposed the health evaluation capabilities of the AlwaysOn Dashboard with PowerShell cmdlets. In this 4 part series, we’ll take a look at how to leverage these cmdlets along with the notification and scheduling capabilities of SQL Agent to build a simple alerting solution.
In part 1, we’ll look at the basic usage of the AlwaysOn health cmdlets.
In part 2, we’ll cover advanced usage of the cmdlets.
In part 3, we’ll build a script with these cmdlets that can be run regularly to monitor your availability group.
In part 4, we’ll show how to integrate this script with SQL Agent to develop a simple alerting mechanism.
Part 1 – Basic overview of using PowerShell to evaluate Availability Group Health
In this part, I’ll cover the basic usage of the AlwaysOn PowerShell cmdlets for evaluating availability group health, and show how these cmdlets map to the functionality supported by the AlwaysOn dashboard.
The Dashboard
Let’s first look at how the AlwaysOn dashboard helps up evaluate the health of an AG. In this and subsequent posts, we’ll be using a simple AG named ‘VLEApplication,’ composed of two synchronous replicas and five databases. Moreover, this AG will be configured to automatically failover in case the primary replica fails.
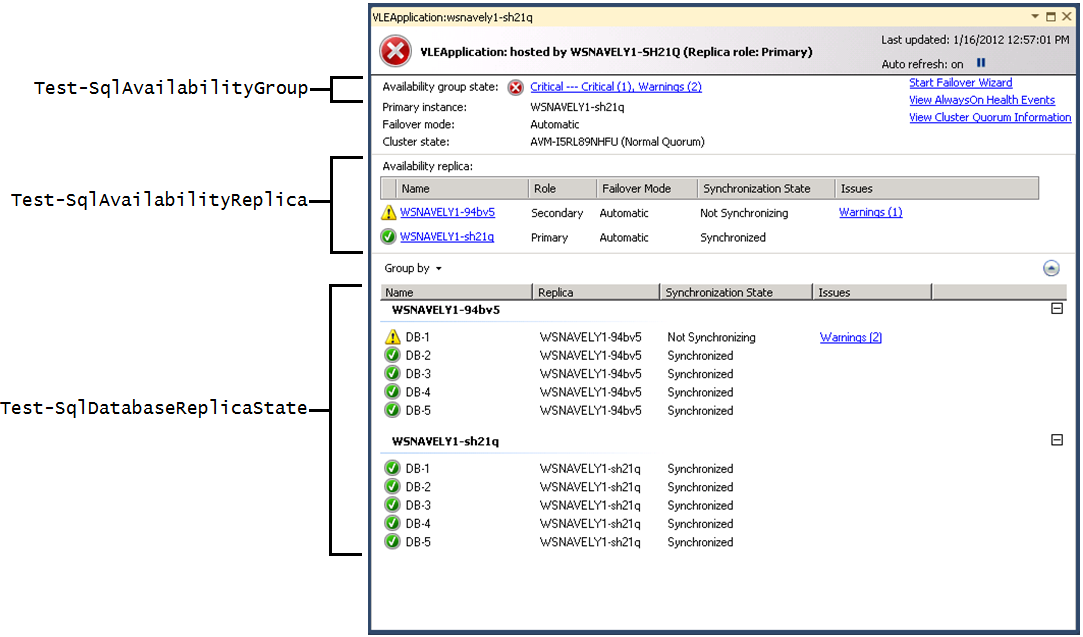
Suppose I open the dashboard for this availability group and see the following. You can launch the dashboard from SQL Server Management Studio by expanding the “AlwaysOn High Availability” folder, right-clicking on an availability group, and selecting “Show Dashboard”.
From visual indicators alone, I know that the availability group is in a bad state, and that the problem is likely coming from DB-1 on the replica named “WSNAVEL1-94bv5”. The dashboard supports a variety of mechanisms for diagnosing this error, but they are outside the scope of this post. Let’s learn how to gather the information exposed by the dashboard using PowerShell.
PowerShell Integration
We expose the health model of the AlwaysOn Dashboard through three PowerShell cmdlets:
- Test-SqlAvailabilityGroup
- Test-SqlAvailabilityReplica
- Test-SqlDatabaseReplicaState
The functionality of these cmdlets can be mapped to the dashboard as follows:
Let’s look at how we can use these cmdlets in an interactive PowerShell session to investigate this availability group. The commands I send to the shell will be bolded, and the output from the shell will be in italics. Also note that for formatting reasons I have shortened my shell prompt.
From a PowerShell window, we can enter the SQL PowerShell environment by running “SQLPS.”
PS > SQLPS
Microsoft SQL Server PowerShell
Version 11.0.2100.18
Microsoft Corp. All rights reserved.
We can now set our location to the AvailabilityGroups folder on the primary server instance (in this case, the default instance on server WSNAVELY1-SH21Q). These cmdlets should always be run on the current primary of the availability group to guarantee accurate results.
PS > cd SQLSERVER:\SQL\WSNAVELY1-SH21Q\DEFAULT\AvailabilityGroups
PS > dir
Name PrimaryReplicaServerName
---- ------------------------
VLEApplication WSNAVELY1-sh21q
Now we can evaluate the health of our availability group using the Test-SqlAvailabilityGroup cmdlet.
PS > Test-SqlAvailabilityGroup .\VLEApplication
HealthState Name
----------- ----
Error VLEApplication
We’ve learned that the availability group is in an error state. Here is how to interpret the HealthState column for this cmdlet (this applies to the other two cmdlets as well):
HealthState |
Meaning |
Error |
The object is in a critical state, high availability has been compromised. |
Warning |
The object is in a warning state, high availability may be at risk. |
Unknown |
The health of the object cannot be determined. This can occur if you execute these cmdlets on a secondary replica. |
PolicyExecutionFailure |
An exception was thrown while evaluating a policy against this object. This can indicate an error in the implementation of the policy. |
Healthy |
The object is in a healthy state. |
Now we’ll drill down and evaluate the health of the replicas in this availability group.
PS > cd .\VLEApplication
PS > dir
AvailabilityDatabases
AvailabilityGroupListeners
AvailabilityReplicas
DatabaseReplicaStates
PS > cd .\AvailabilityReplicas
PS > dir
Name Role ConnectionState RollupSynchronizationState
---- ---- --------------- --------------------------
WSNAVELY1-94bv5 Secondary Connected NotSynchronizing
WSNAVELY1-sh21q Primary Connected Synchronized
PS > dir | Test-SqlAvailabilityReplica
HealthState AvailabilityGroup Name
----------- ----------------- ----
Warning VLEApplication WSNAVELY1-94bv5
Healthy VLEApplication WSNAVELY1-sh21q
We learn that the replica hosted on server WSNAVELY1-94bv5 is in a warning state. Note how we use the pipeline to evaluate the health of all replicas in one shot. Next, we’ll evaluate the health of the databases participating in this availability group.
PS > cd ..
PS > cd .\DatabaseReplicaStates
PS > dir
AvailabilityReplicaServerName AvailabilityDatabaseName SynchronizationState
----------------------------- ------------------------ --------------------
WSNAVELY1-94bv5 DB-1 NotSynchronizing
WSNAVELY1-94bv5 DB-2 Synchronized
WSNAVELY1-94bv5 DB-3 Synchronized
WSNAVELY1-94bv5 DB-4 Synchronized
WSNAVELY1-94bv5 DB-5 Synchronized
WSNAVELY1-sh21q DB-1 Synchronized
WSNAVELY1-sh21q DB-2 Synchronized
WSNAVELY1-sh21q DB-3 Synchronized
WSNAVELY1-sh21q DB-4 Synchronized
WSNAVELY1-sh21q DB-5 Synchronized
PS > dir | Test-SqlDatabaseReplicaState
HealthState AvailabilityGroup AvailabilityReplica Name
----------- ----------------- ------------------- ----
Warning VLEApplication WSNAVELY1-94bv5 DB-1
Healthy VLEApplication WSNAVELY1-94bv5 DB-2
Healthy VLEApplication WSNAVELY1-94bv5 DB-3
Healthy VLEApplication WSNAVELY1-94bv5 DB-4
Healthy VLEApplication WSNAVELY1-94bv5 DB-5
Healthy VLEApplication WSNAVELY1-sh21q DB-1
Healthy VLEApplication WSNAVELY1-sh21q DB-2
Healthy VLEApplication WSNAVELY1-sh21q DB-3
Healthy VLEApplication WSNAVELY1-sh21q DB-4
Healthy VLEApplication WSNAVELY1-sh21q DB-5
We learn that the database DB-1 on replica WSNAVELY1-94bv5 is in a warning state. At this point, we’ve evaluated the health of all objects in this availability group, and know which objects require further investigation. In Part 2, we'll see how we can use these cmdlets to drill down into unhealthy objects, and see some other advanced use cases.
Comments
Anonymous
July 17, 2012
Good job Will Snavely!. I have linked your articles in our team blog blogs.msdn.com/.../monitoring-alwayson-health-with-powershell-and-sql-agent.aspxAnonymous
August 11, 2014
Awesome documentation. Thanks for putting this together.

