Part 2: Using Configuration Manager Dashboard for Software Update Deployment Readiness (Patch Tuesday Checklist)
In my previous post I talked about some of the critical checks performed for Software Update Deployment readiness as part of routine ConfigMgr administrator task prior to every 2nd Tuesday of month to ensure ConfigMgr hierarchy is ready for deploying any critical security updates to all systems.
Now with the recent release of Configuration Manager dashboard, I thought to automate this readiness checks by creating a single view to review the overall status for Configuration Manager component status which are critical for Software Update Deployment readiness.
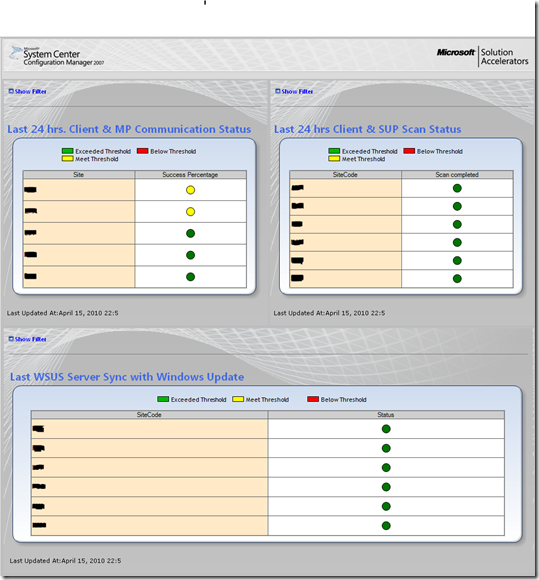
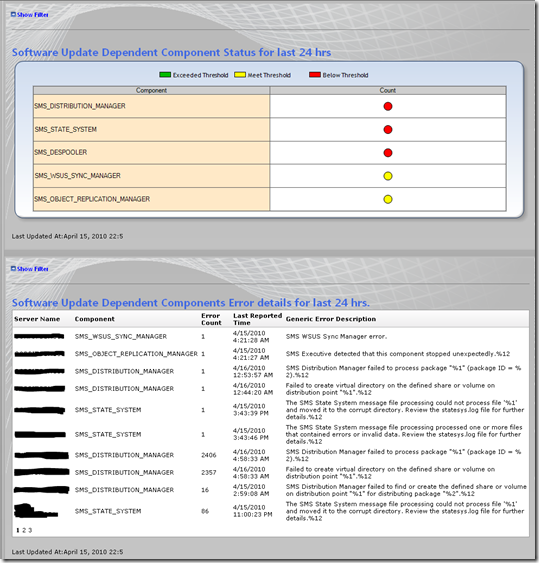
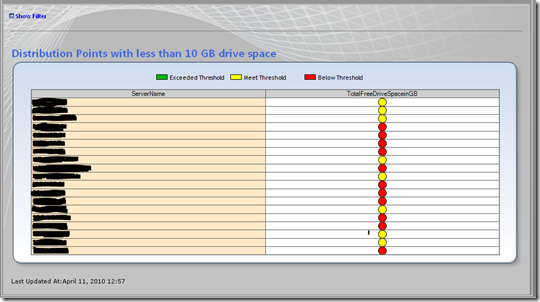
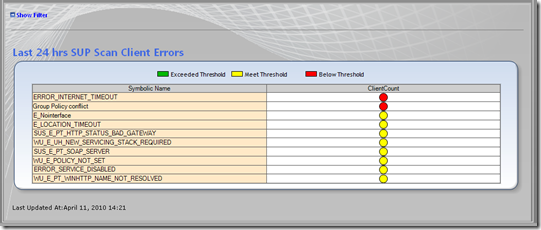
Here is sneak view for the dashboard threshold, Scorecard, and queries I used to create this Configuration Manager dashboard:
Scorecard Threshold
|
|||
Last 24 hrs. Client & MP Communication Status
|
<90 %
|
>90% and <95%
|
>95%
|
Last 24 hrs. Client & SUP Scan Status
|
<90 %
|
>90% and <95%
|
>95%
|
Last WSUS Server Sync with Windows Update
|
> 1 day
|
Not Applicable |
< 1 day
|
Software Update Dependent Component Status for last 24 hrs.
|
>1 and <5 error msgs
|
>5 error msgs
|
Not Applicable |
Distribution Points with less than 10 GB drive space
|
< 5 GB
|
>5GB and <10 GB
|
Not Applicable |
Last 24 hrs. SUP Scan Client Errors
|
>1000 Clients errors
|
<1000s Client errors
|
Not Applicable |
SQL Queries I used to create above dashboard.
Last 24 hrs. Client & MP Communication Status (%)
declare @olddate datetime
set @olddate=DATEADD(HOUR,-24, getdate())
SELECT sub.[Site]
,SUM(CASE sub.HealthState
WHEN 1 THEN sub.Cnt
END) AS 'Client successfully communicating with MP'
,SUM(CASE sub.HealthState
WHEN 2 THEN sub.Cnt
END) AS 'Client failing to communicate with MP'
,SUM(sub.Cnt) AS 'Total'
,ROUND((CAST(SUM(CASE sub.HealthState
WHEN 1 THEN sub.Cnt
END) AS float) / SUM(sub.Cnt)) * 100,2) AS 'Success Percentage'
FROM (
SELECT sit.SiteCode AS 'Site'
,chs.HealthState
,COUNT(chs.HealthState) AS 'Cnt'
FROM v_Site sit
INNER JOIN v_ClientHealthState chs
ON sit.sitecode = chs.assignedsitecode
AND chs.HealthType = '1000'
AND chs.lasthealthreportdate > @olddate
AND sit.[Type] = 2
GROUP BY sit.SiteCode
,chs.HealthState
) sub
GROUP BY sub.[Site]
ORDER BY sub.[Site]
Last 24 hrs. Client & SUP Scan Status (%)
declare @olddate datetime
set @olddate=DATEADD(HOUR,-24, getutcdate())
declare @dn1 table (clients numeric, SiteCode varchar(3),statename varchar(20))
declare @dn2 table (SiteCode varchar(3), totals numeric)
declare @dn3 table (SiteCode varchar(3), pclients numeric, tstatename varchar(50))
insert into @dn1(clients,SiteCode,statename)
select count(*)as clients,site.sms_assigned_sites0 as SiteCode,statename
from v_updateScanStatus upp
join v_statenames stat on stat.stateid = upp.lastscanstate
join v_RA_System_SMSAssignedSites site on site.resourceid = upp.resourceid
and stat.topictype ='501' and upp.lastscanpackagelocation like'http%' where statename in ('Scan Completed ','Scan Failed ')
group by upp.lastscanstate,stat.statename,site.sms_assigned_sites0
order by site.sms_assigned_sites0,clients desc
insert into @dn2(SiteCode,totals)
select SiteCode as SiteCode, SUM(clients) from @dn1 group by SiteCode
insert into @dn3(SiteCode,pclients,tstatename)
select t1.SiteCode as SiteCode,(clients/totals*100),statename from @dn1 as t1, @dn2 as t2 where t1.SiteCode = t2.SiteCode
select * from @dn3 PIVOT (sum(pclients) for [tstatename] in ([Scan completed],[Scan failed]) ) as A
Last WSUS server sync with Windows Update
select SiteCode, ContentVersion, SyncTime from dbo.update_syncstatus order by SyncTime
Site Servers Not Communicated in Last 24 hrs.
SELECT Distinct SiteCode, Role
, (SELECT TOP 1 TimeReported) AS LastReportedTime
, getdate() AS CurrentTime
FROM Summarizer_SiteSystem NOLOCK
where TimeReported < DATEADD(HOUR,-24, getutcdate())
Software Update Dependent Component Status
Please change the text in RED below with specific site code and we have custom database and table created for mapping all error code with error descriptions so that is not included in the below query.
SELECT MessageID
,sm.Severity
,MachineName
,COUNT(*) as 'Count'
,MAX(Time) as 'LastOccurred'
,Component
FROM v_StatusMessage sm WITH (NOLOCK)
WHERE ModuleName = 'SMS Server'
AND Sm.Severity != 1073741824
and Component in
('SMS_OBJECT_REPLICATION_MANAGER',
'SMS_WSUS_Configuration_Manager',
'SMS_WSUS_Control_Manager',
'SMS_WSUS_Sync_Manager',
'SMS_Despooler',
'SMS_Distribution_Manager',
'SMS_Executive',
'SMS_SQL_Monitor',
'SMS_State_System')
AND Time > DATEADD(hour, -24, GetDate())
AND SiteCode in ('[SiteCode1]','[SiteCode2]','[SiteCode3]')
GROUP BY MessageID, MachineName, Component, sm.Severity
ORDER BY 4 desc
Distribution Points with less than 10 GB free disk space
Please change the text in RED below with specific drive for DP package location or remove it if it’s not standard on all DPs
select distinct RoleName, ServerName, SR.SiteCode, (SELECT TOP 1 SS.TimeReported)AS LastReportedTime, BytesTotal/1048576 as TotalDriveSpaceinGB, BytesFree/1048576 as TotalFreeDriveSpaceinGB, percentfree from SysResList SR
Left join Summarizer_SiteSystem SS on SS.SiteSystem = SR.NALPath
where BytesFree < 5242880 and
RoleName = 'SMS Distribution Point' and
SS.SiteObject like '%F$\' and
TimeReported > DATEADD(HOUR,-24, getdate())
Last 24 hrs SUP Scan Client Errors
We have custom database and table created for mapping all error code with error descriptions so that it is not included in the below query as shown in the above dashboard for error description.
select Top 10 LastErrorCode,
COUNT(*) as ClientCount from v_updateScanStatus up
join v_r_system sys on sys.resourceid = up.resourceid
where lastscantime >DATEADD(hour,-24, getutcdate())
and lastscantime < getutcdate()
and LastErrorCode != 0
group by LastErrorCode
order by count (*) desc
Please share your comments and thoughts for this dashboard dataset or any queries for using the Configuration Manager Dashboard.
Disclaimer: The information on this site is provided "AS IS" with no warranties, confers no rights, and is not supported by the authors or Microsoft Corporation. Use of included script samples are subject to the terms specified in the Terms of Use
Comments
Anonymous
May 05, 2010
Hi Shitanshu, I attended your MMS presentation and really loved your dashboards. Do you have more detailled how to steps to create those dashboards. I already have The acelerator installed and I am able to see the default ones. I just need the steps to add your SQL Queries. Thanks, Chris.Anonymous
June 28, 2010
These are fantastic, many thanks for sharing this informationAnonymous
June 30, 2010
The comment has been removedAnonymous
October 10, 2010
Wouldn't it be great if you could create a ConfigMgr Dashboard that showed you your Patch complianceAnonymous
July 24, 2011
Anyone know what kind of access the SCCM dashboard application pool account needs to the SCCM site server and database as this is where we are installing the Dashboard session database as well? I've only been able to get it to work when the account is in the local admin. Problem is, that isn't going to fly in our environment.Anonymous
July 25, 2011
The comment has been removed


