Construct 2 – Display High Scores
As I prepare for my 2nd Microsoft Virtual Academy course on Game Development with Construct 2, I am realizing how many supporting blog posts I need to add. For example, before I get into saving Global High Scores using Microsoft Azure, it would be useful to see how to actual display a table with high scores. So, let’s take a look at how we do that!
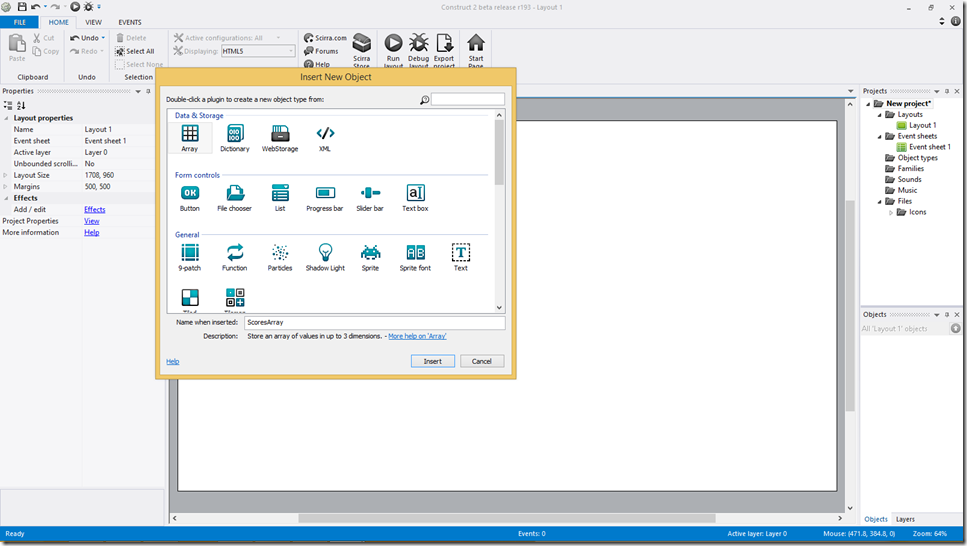
I’m going to start with a more or less empty project, so the first thing I want to add is an Array object called ScoresArray to hold all of our usernames and scores, shown below. If you need a refresher on using arrays to store data, you can reference this youtube video, https://www.youtube.com/watch?v=h9qpCQ0uVic.
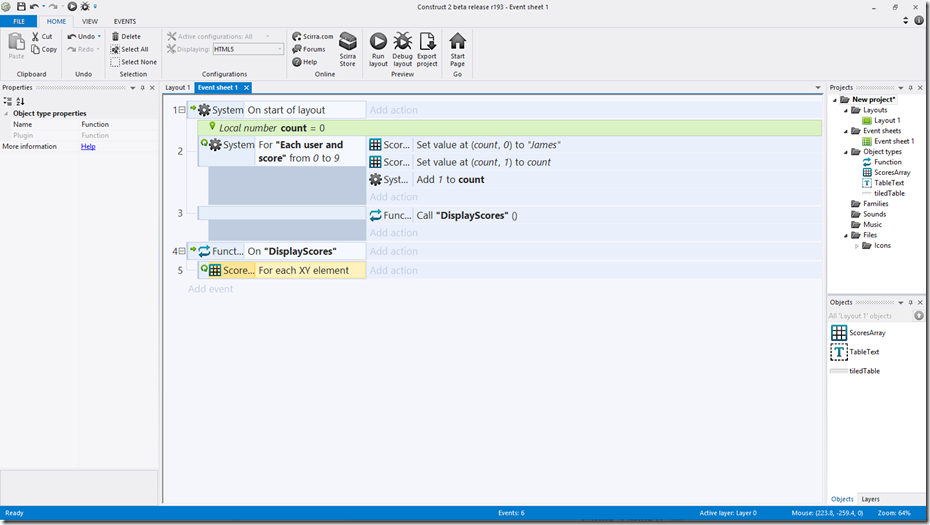
After you add the ScoresArray, let’s jump over to our event sheet. First off, ensure that your array is a 10X2 as shown in properties Window. Secondly, I’ve already added a couple of pieces of logic here. All I am doing is populating my array with usernames and scores. The username is always James, and the corresponding scores are 0-9 for simplicity sake. You can reference this video if you need some background, https://www.youtube.com/watch?v=h9qpCQ0uVic.
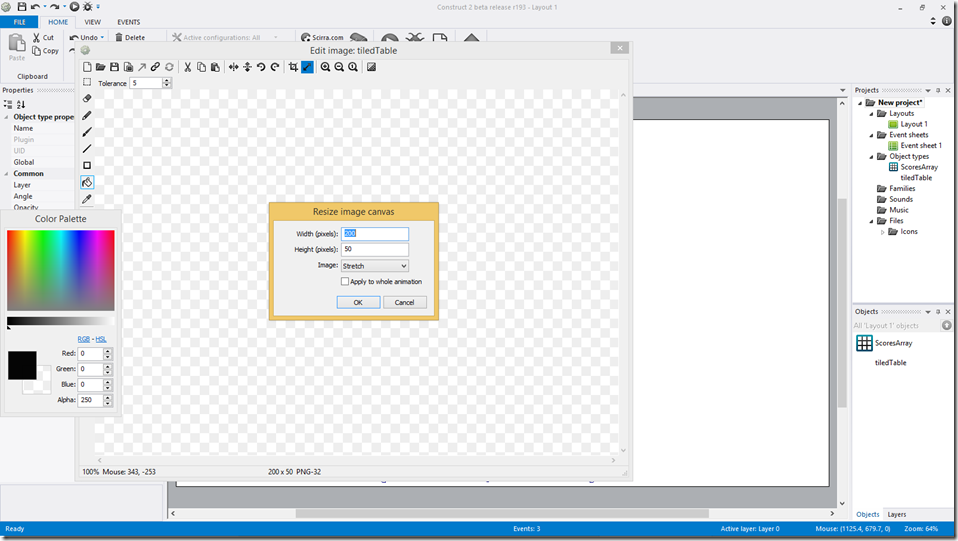
Next, I am adding a TiledBackground called TiledTable. You don’t have to do this part if you don’t want, but it makes the table look a little cleaner/nicer. If you want to do this, you can simply add a grey rectangle that has the following size, 200X50.
Then, set your tiledTable position to 0,0 and its size to 400,500. Should look like the table below.
We now have the background for our table. Now we need to create the text object that will actually display the name and/or score. Create a text object called TableText.
Ensure the size is 200X50 and drag the Text object off of the layout. We don’t want it to be visible initially.
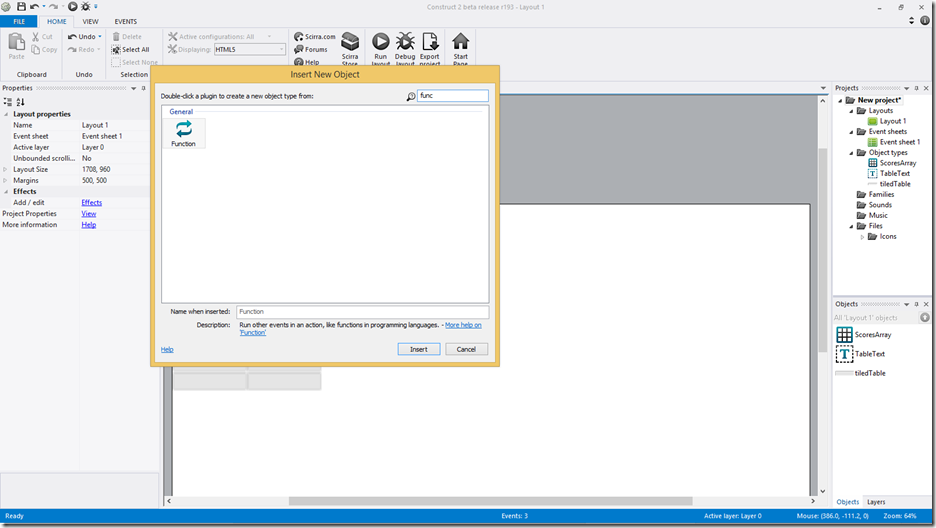
Now, let’s add the function object.
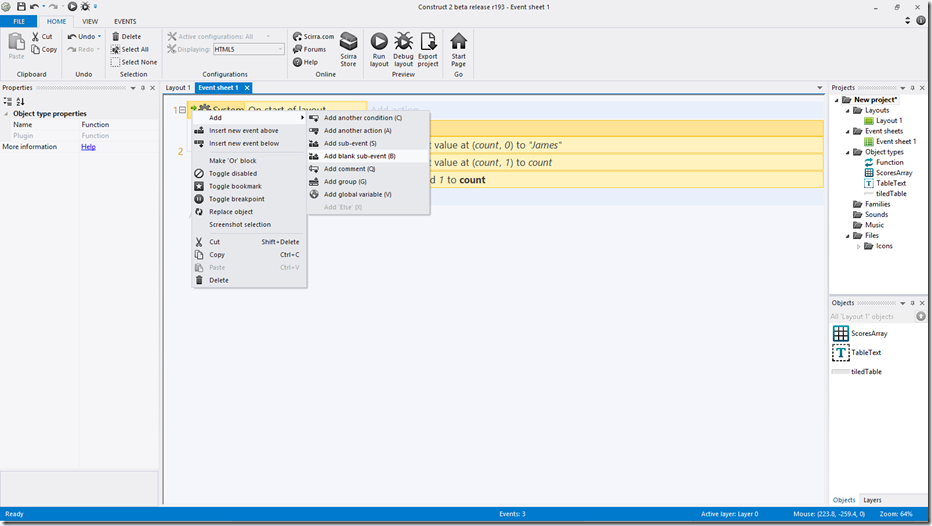
Back in our Event Sheet, let’s add a Blank Sub-Event to On Start of Layout.
As the action for the blank sub-event, use Function->Call Function-> “DisplayScores”. Then, define the function using Function->On Function->”DisplayScores”. Both steps should lead to the following.
Now, we need to iterate through each element of the array, and display it to the user. This video, Arrays and For Loops, will show you how to iterate through each element of an array for additional background. To accomplish this here, we want to add a Sub-Event to our “DisplayScores” event. Choose ScoresArray->For Each XY to iterate through each element.
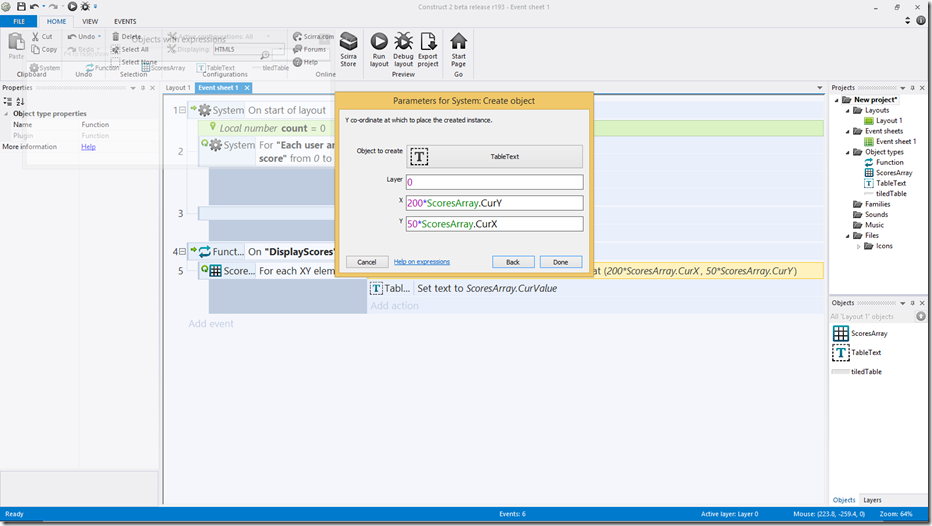
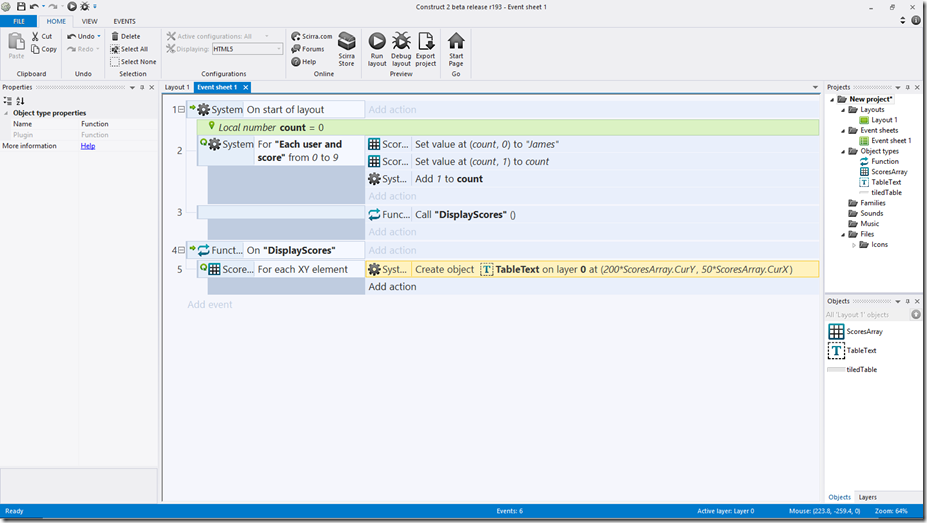
For each iteration, we will have access to the current X and Y values via ScoresArray.CurX and ScoresArray.CurY. We need to use both of those values to decide where to create each TableText object. There will be one for each name and each score. Since each TableText is 200*50 we want to make the X and Y coordinates multiples of 200 and 50. Take a look a below. Notice that CurY is used for the X coordinate and CurX is used for the Y coordinate. This part is slightly confusing, but you can just follow the screenshot.
Looks like this.
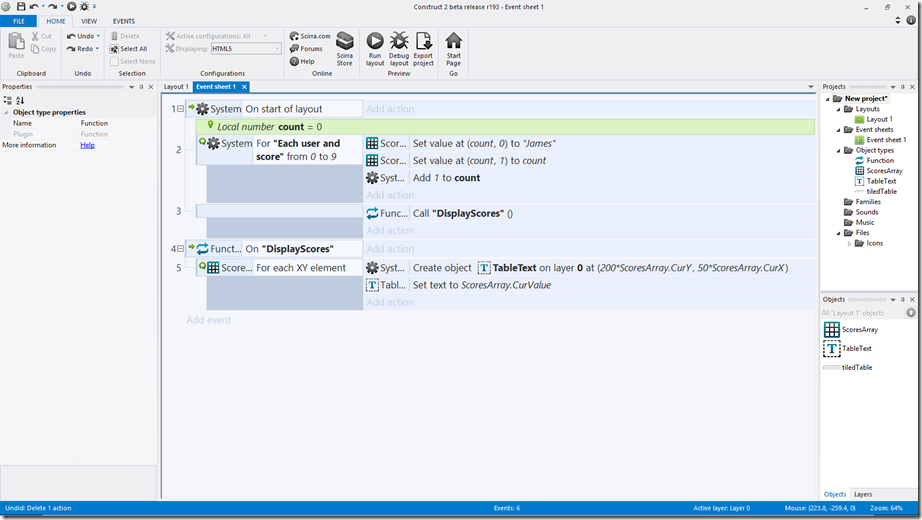
Lastly, set the text for the newly created TableText object to the CurValue in our array using ScoresArray.CurValue.
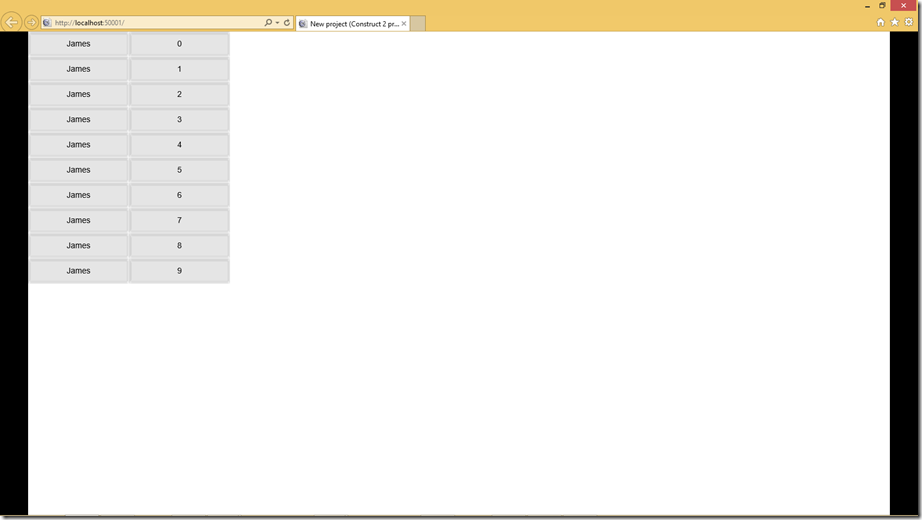
After all this, let’s run to see our fancy table!
Perfect! If you had any trouble, you can find the finished example here, We now know how to display usernames and scores in a table format! Any questions, comments, concerns, please comment below or find me on twitter @jamesqquick.
