Resource Contention Concurrency Profiling in Visual Studio 2010 – Performance Investigation Flows
Visual Studio 2010 brings a number of innovations to multithreaded and parallel computing. One of them is Resource Contention Concurrency Profiling. John Robbins gives a really great first look at this feature in his Wintellect VS 2010 Beta 2 Concurrency Resource Profiling In Depth First Look post. The June 2010 issue of MSDN magazine contains the Resource Contention Concurrency Profiling in Visual Studio 2010 article with a detailed explanation of this profiling mode, including various ways of data collection and presentation and some guidance to efficient data analysis. Here I would like to append the article with some additional valuable information.
The table below presents a subset of VS2010 performance data views. Those views are useful while investigating results of Resource Contention Concurrency Profiling.
View |
Description |
Summary |
Summary information is presented to serve as a starting point for your investigation. This is the first view you see, and it is opened automatically after the profiling session is over and result file is ready. |
Resource Details |
A detailed view of a specific resource (for example, a lock), showing all threads that were blocked on it during the application lifetime. |
Thread Details |
A detailed view of a specific thread, showing all resources (such as locks) the thread was blocked on. |
Contention |
Call trees that are separated per contention resource. In other words, this view presents a set of call trees, each containing stacks that were blocked on a specific resource. |
Processes |
A list of inspected processes, where each process has a list of its threads, and each thread is attributed with the number of contentions it experienced, and summarized length of blocked time. |
Function Details |
A detailed view of a specific function, including functions it calls and collected data. |
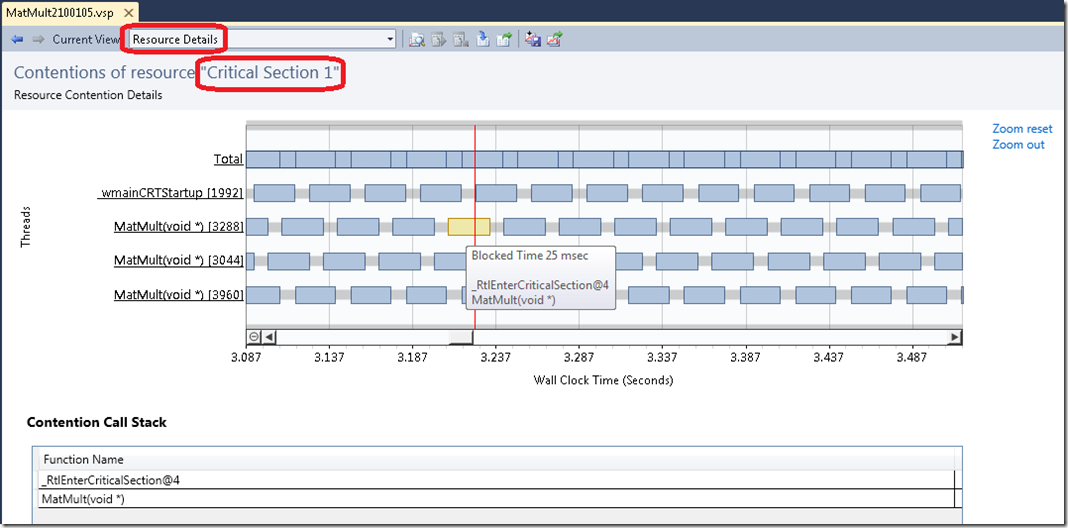
The Resource Details view, for example, is the following one:
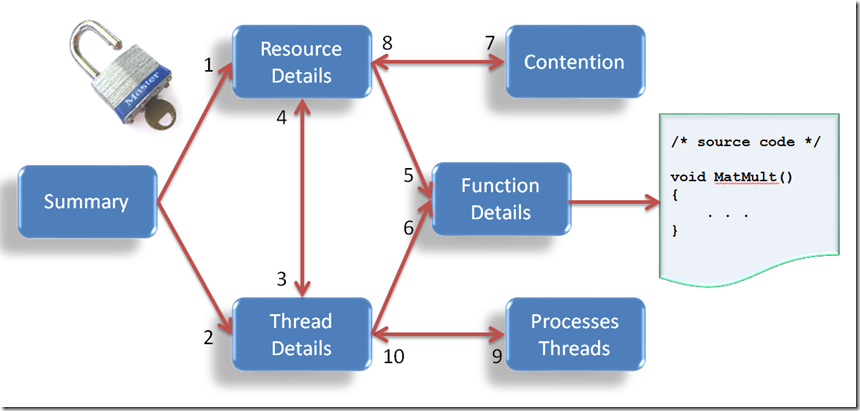
There are several built-in transitions between profiling data views inside VS2010, and they are explained in the article. Let me briefly summarize those transitions through the below diagram, which presents possible performance investigation flows. When you analyze your data, do not feel obligated to use VS2010 views in that exact order or sequence – you can always select any desired view through a drop-down combo box of VS2010 that enumerates all views. The diagram is just a suggestion how that can be done.
The transitions that are enumerated on the diagram are:
1. Move from Summary view to Resource Details view (chart) by clicking a resource name in the Most Contended Resources table
2. Move from Summary view to Thread Details view (chart) by clicking a thread ID in the Most Contended Threads table
3. Switch from Resource Details view to Thread Details view by clicking on a chart label, representing the thread
4. Switch from Thread Details view to Resource Details view by clicking on a chart label, representing the resource
5. Move from Resource Details view to Function Details view by double clicking on a function name in Contention Call Stack panel
6. Move from Thread Details view to Function Details view by double clicking on a function name in Contention Call Stack panel
7. Move from Resource Details view to Contention view by clicking on a Total label of the chart
8. Move from Contention view to Resource Details view through a context menu (right-click) of a resource
9. Move from Thread Details view to Processes/Threads view by clicking on a Total label of the chart
10. Move from Processes/Threads view to Thread Details view through a context menu of a thread
When you open the profiling results file, you see a Summary view that helps you to select a possible investigation direction. Some options to consider here are:
- Start in Summary view, detect a contention resource or a thread you want to inspect closely (because it has too many contentions), then explore data through the transitions:
- 1 – to see resource details, or 2 – to see thread details
- 4 and 3 – to pivot between resources and threads details
- 5 and 6 – to see details of function causing the contention
- Start in Summary view, use drop-down combo box to switch to Contention view, sort all resources, select one of them, then use transition 8 to get to the resource details, followed by transitions 4, 3, 5 and 6 as required.
- Start in Summary view, use drop-down combo box to switch to Processes/Threads view, sort all threads, select one of them, then use transition 10 to get to the thread details, followed by transitions 4, 3, 5 and 6 as required.

