Measuring DPC time
At the DDC this year we had some very useful “community forums”. I generally come out of these feeling like I've been beaten with a sack of oranges, and this year was no exception. But one question in particular struck my eye – someone was saying that MS didn’t provide any useful tools for figuring out why the DPC latency they were seeing on notebooks was so poor. When he asked about this my first thought was “I bet XPerf can do that”.
XPerf, for those who haven’t seen it, is part of a performance toolkit that the Windows performance team released. It collects ETW events reported by various system components and then provides an … interesting … UI to pull all of those events together into graphs and visualize what in the world is going on.
The down-side of XPerf is that it can be very hard to use. Every time I approach this tool I think “wow that’s a lot of data to make sense of”. But I would think that we can use it to collect information about what DPCs are running and how long they run for.
Once I installed XPerf I went into the installation directory and looked at the tools that it provides. There are two interesting tools – XPerf.exe and xperfview.exe. The first allows you to easily start and stop trace sessions, merge trace logs and do some data processing on the resulting logs. The second is the GUI visualization tool and lets you see your trace data. Let’s start with XPerf:
C:\xperf>xperf
Microsoft (R) Windows (R) Performance Analyzer Version 4.1.6512
Performance Analyzer Command Line
Copyright (c) Microsoft Corporation. All rights reserved.
Usage: xperf options ...
xperf -help view for xperfview, the graphical user interface
xperf -help start for logger start options
xperf -help providers for known tracing flags
xperf -help stackwalk for stack walking options
xperf -help stop for logger stop options
xperf -help merge for merge multiple trace files
xperf -help processing for trace processing options
xperf -help symbols for symbol decoding configuration
xperf -help query for query options
xperf -help mark for mark and mark-flush
xperf -help format for time and timespan formats on the command line
Well we want to use this to start a trace session, so let’s start with xperf –help start:
C:\xperf>xperf -help start
Trace start options:
xperf [-start|-update [LoggerName]] -on Flags|Groups options ...
or -flush [LoggerName] ...
or -SetProfInt [<n>] [cached]
User provider format for -on: (GUID|KnownProviderName)[:Flags[:Level]]
-start LoggerName Start a logging session for LoggerName
-update LoggerName Update a logging session for LoggerName
-flush LoggerName Flush a logging session for LoggerName
-on Flags|Groups For kernel logging sessions, the sequence of
kernel flags and groups to be enabled,
separated by '+'. For user logging
sessions, the sequence of providers to be
enabled, separated by '+'. The accepted
provider format is:
(GUID|KnownProviderName)[:Flags[:Level]].
Use "xperf -help providers" for a list of
valid flags
-f filename Log events to specified file; default:
\kernel.etl for kernel traces and \user.etl
for user traces
-BufferSize Size Set trace buffer size to Size KB (4 KB -
1024 KB); default: 64 KB
-MinBuffers n Set minimum number of trace buffers to n;
default: 64
-MaxBuffers n Set maximum number of trace buffers to n;
default: 320
-MaxFile Size Set maximum file size to Size MB
-FlushTimer n Set the flush timer to n seconds
-BootTrace Flags|Groups|off Config the Event Tracing For Windows Logger
to trace boot. Set flags as "off" to turn
off boot tracing. All loggering control can
be used in conjunction with this. Use in
conjunction with -f to log to a file other
than \Perf.etl.
-RealTime Enable real time tracing
-Buffering Enable buffering mode tracing
-FileMode Mode Set the File Mode; default: Sequential.
Mode: Sequential, Circular, Append, NewFile
-ClockType ClockType Set the clock type; default: PerfCounter.
Type: Cycle, PerfCounter, SystemTime.
-StackWalk flags|@file Enable stack walking for the events
specified as Flag+Flag+..., or parse 'file'
file for flags. Run "xperf -help stackwalk"
for more information.
-Pids pid [...] Apply flags to processes pid [...]. Used in
conjunction with private loggers.
-PidNewProcess <command-line> Apply flags to a new process xperf will
start with <command-line>. Used in
conjunction with private loggers.
-heap Enable heap tracing in processes specified
by Pids and PidNewProcess.
-critsec Enable critical section tracing in processes
specified by Pids and PidNewProcess.
-SetProfInt [<n>] [cached] Set sampled profile interval to <n> [1221 ..
10000000]. If "cached" is specified,
intervals are cached in ETW and reapplied
whenever new ETW kernel loggers with sampled
profile are started. [Default: <n> = 10000;
not cached]
Multiple loggers can be started using multiple -start options, each followed by
the options to be applied to that logger. If LoggerName, or -start LoggerName,
is omitted, the Kernel Logger is implied. Only a single instance of Kernel
Logger can exist at any time. If one of the loggers fails to start, all the
already started loggers are stopped.
The only required argument to –start is a set of flags. The definition of Flags says to look at xperf providers to see what the possible flags are. The help for that command says:
C:\xperf>xperf -help providers
Providers Query options:
xperf -providers [Installed|I] [Registered|R] [KernelFlags|KF] [KernelGroups|KG] [Kernel|K]
Query all installed/known and registered providers, as well as all known kernel flags and groups.
The following options are supported:
I, Installed : include Installed/known providers
R, Registered : include Registered providers
KF, KernelFlags : include Kernel Flags
KG, KernelGroups : include Kernel Groups
K, Kernel : include Kernel flags and groups; shortcut for "KF KG".
If no options are specified, all providers are included in the output.
We want to look at DPC’s, so let’s dump just the kernel providers (if only because dumping all of them would probably exceed what I can post in one blog entry ).
C:\xperf>xperf -providers K
Kernel Flags:
PROC_THREAD : Process and Thread create/delete
LOADER : Kernel and user mode Image Load/Unload events
PROFILE : CPU Sample profile
CSWITCH : Context Switch
COMPACT_CSWITCH: Compact Context Switch
DISPATCHER : CPU Scheduler
DPC : DPC Events
INTERRUPT : Interrupt events
SYSCALL : System calls
PRIORITY : Priority change events
ALPC : Advanced Local Procedure Call
PERF_COUNTER : Process Perf Counters
DISK_IO : Disk I/O
DISK_IO_INIT : Disk I/O Initiation
FILE_IO : File system operation end times and results
FILE_IO_INIT : File system operation (create/open/close/read/write)
HARD_FAULTS : Hard Page Faults
FILENAME : FileName (e.g., FileName create/delete/rundown)
SPLIT_IO : Split I/O
REGISTRY : Registry tracing
DRIVERS : Driver events
POWER : Power management events
NETWORKTRACE : Network events (e.g., tcp/udp send/receive)
VIRT_ALLOC : Virtual allocation reserve and release
MEMINFO : Memory List Info
ALL_FAULTS : All page faults including hard, Copy on write, demand zero faults, etc.
Kernel Groups:
Base : PROC_THREAD+LOADER+DISK_IO+HARD_FAULTS+PROFILE+MEMINFO
Diag : PROC_THREAD+LOADER+DISK_IO+HARD_FAULTS+DPC+INTERRUPT+CSWITCH+PERF_COUNTER+COMPACT_CSWITCH
DiagEasy : PROC_THREAD+LOADER+DISK_IO+HARD_FAULTS+DPC+INTERRUPT+CSWITCH+PERF_COUNTER
Latency : PROC_THREAD+LOADER+DISK_IO+HARD_FAULTS+DPC+INTERRUPT+CSWITCH+PROFILE
FileIO : PROC_THREAD+LOADER+DISK_IO+HARD_FAULTS+FILE_IO+FILE_IO_INIT
IOTrace : PROC_THREAD+LOADER+DISK_IO+HARD_FAULTS+CSWITCH
ResumeTrace : PROC_THREAD+LOADER+DISK_IO+HARD_FAULTS+PROFILE+POWER
SysProf : PROC_THREAD+LOADER+PROFILE
Network : PROC_THREAD+LOADER+NETWORKTRACE
That “Latency” group sounds interesting – it includes DPCs and interrupts along with process/thread create/delete and loader events (both of which it turns out are needed if you want to see what process anything is happening in). So let’s start up a trace session for “Latency”.
C:\xperf>xperf -on Latency
Now to create some “load” I'll use WMP to watch the stock footage of a bear in the river. Then I exit WMP and stop the trace:
C:\xperf>xperf -stop
C:\xperf>dir \kernel.etl
Volume in drive C is Safe
Volume Serial Number is 042D-D2B2
Directory of C:\
10/06/2008 04:52 PM 16,384,000 kernel.etl
1 File(s) 16,384,000 bytes
0 Dir(s) 57,208,664,064 bytes free
By default the kernel logger dumped all 16 MB of output into c:\kernel.etl. Now if we want to see what’s in that file we can load it up with xperfview:
C:\xperf>xperfview \kernel.etl
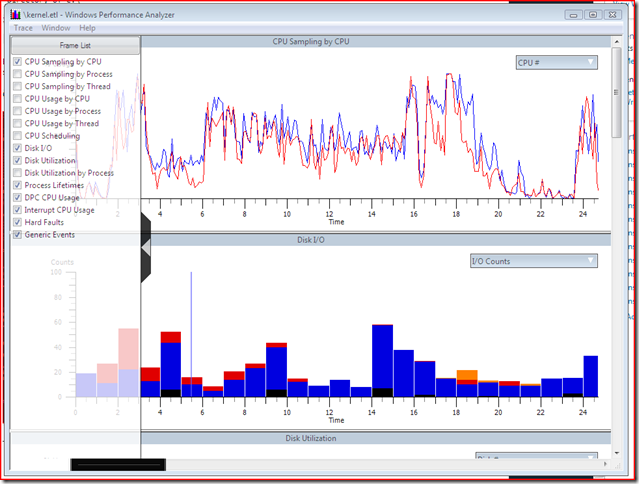
These are two of 15 different graphs that XPerf makes available from the .ETL file. Here we can see the CPU time for both of my CPUs as well as a count of disk I/O operations in flight over the collection period. I have pulled out the menu of “frames” that you can enable (clicking on the chevron in the middle will make it disappear or reappear).
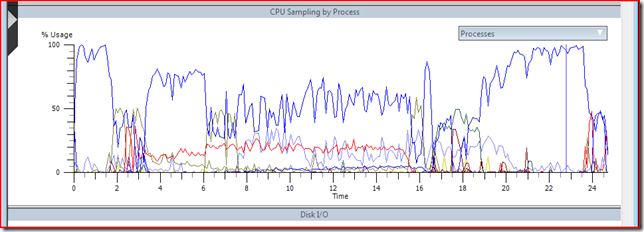
Let’s say that I want to drill in on this a little bit, and look at CPU time just for a single process – say WMPLAYER.EXE since I was watching a video. I can select the “CPU Sampling by Process” option from the frame list:
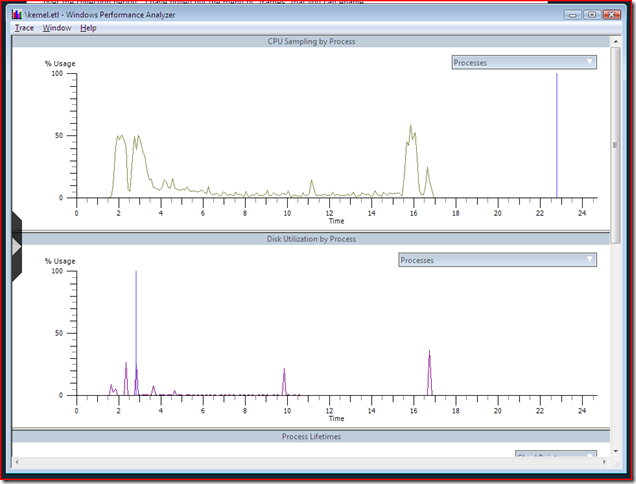
And then click the down arrow next to “Processes” and select just WMPLAYER.EXE (The short cut to do this is to click All, then click it again to unselect everything, then scroll and find just the one or two processes that you need"). If we do this with Disk Utilization as well, and remove the intervening frames we can get a side-by-side view of CPU activity and disk I/O for one process that looks like this:
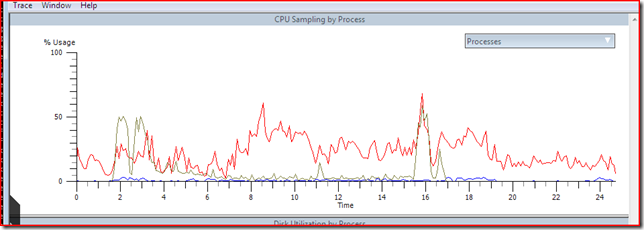
We can also overlay the DPC activity on top of the CPU graph if we want. Right click in the CPU Sampling by processor frame and choose “Overlay Graph” then “DPC CPU Usage” and “All” processors:
The red and blue lines are CPU 0 and CPU 1 respectively, with the yellow line still showing normal CPU utilization for WMPLAYER.EXE.
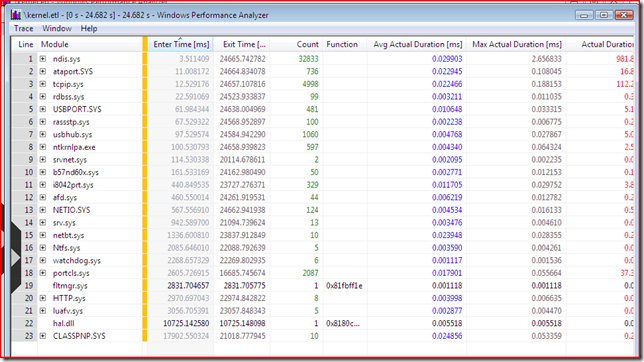
XPerfView also has the ability to show you your data in pivot-table form. Let’s say we want to look at DPC CPU Utilization. Right click on any frame showing DPC data (either the merged graph we just setup above, or re-enable the DPC frame from the frame list) and choose “Summary Table” and you’ll get something like this:
This is showing us every DPC event in the .ETL file. The columns on the left of the yellow line control how the data is grouped and the columns to the right of the line show us the aggregate results for that grouping. Here we’re grouped by module name and we can see the total count and average and max duration of all of the DPCs for that module. NDIS stands out with a 2.6 ms DPC. If you want to see every DPC in a particular module (sorted by “Enter Time”) you can click the + box next to the name and the view will expand.
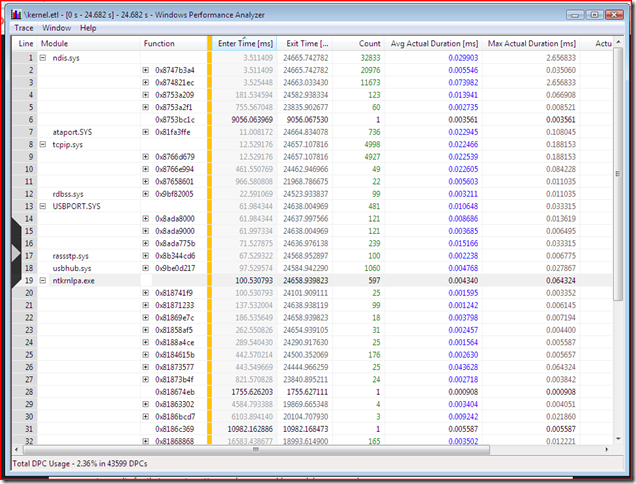
Let’s say we want to see all the entries grouped not just by module but by the actual DPC routine within that module. The function column shows us the address of the DPC routine that was executed. If we drag that to the right of the yellow line we get a new grouping:
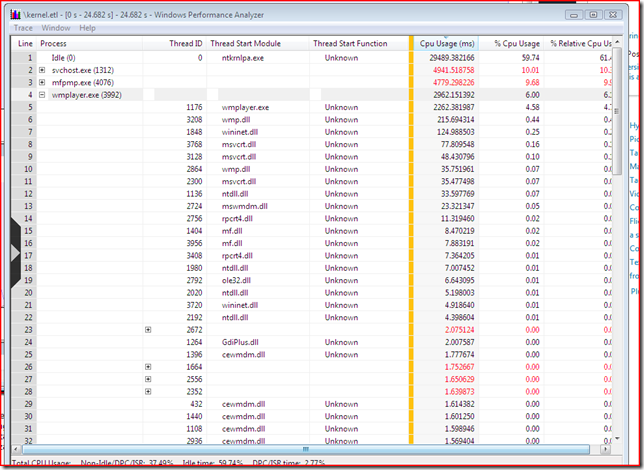
For each module we can see which DPC function is being called the most and which one is taking up so much time. You can use this to find out other things, like which threads in WMP are taking up time and what thread routine they are running. Go back and enable the CPU Utilization by processor frame then get a summary table for that:
This would all be more impressive if symbol loading were working. In theory XPerf can load symbols and use them to determine the name of the function rather than just showing an address or “Unknown”. However I’ve rarely gotten symbol loading to work, and when it does work it still seems pretty fragile. If you use xperf –help symbols it provides some help on getting symbols working.
There’s one more handy trick that I found while I was trying to get symbols to work. XPerf.exe has some processing options too. XPerf –help processing shows us a list of the options:
C:\xperf>xperf -help processing
Trace Post-Processing options:
xperf -I <trace file> ... [-o output] [-symbols ...] [-target {human|machine}]
[-a action ... [-a action ...] ...]
-I trace file The trace file to be processed.
-o output file Optional, the name of the file that output goes to. If not
given, stdout is used.
-symbols [options] Enable and configure symbol decoding support.
See "xperf
-help symbols" for detailed help
-target {human|machine} Select the target audience of the output. Default is human.
-quiet Do not print progress information.
-tle Process the trace even in the presence of lost events.
-tti Process the trace even in the presence of time inversions.
-a action ... Optional, the actions to take. Default action is to dump
the event in text form.
Examples:
xperf -I trace.etl -o out.csv : dump the events in trace.etl to file out.csv
xperf -help registry : print help on action registry
xperf -I trace.etl -a registry : print registry access statistics to stdout
xperf -I trace32.etl trace64.etl -o out.csv : dump the events in trace32.etl and trace64.etl to file out.csv
Available Actions:
boot Show boot and shutdown statistics
bootprefetch Show boot-time prefetching information
cpudisk Show CPU/Disk activity report
cswitch Show Context Switch data
diskio Show Disk IO Statistics
dpcisr Show DPC/ISR Statistics
drvdelay Show Driver delays
dumper Dump events in the trace in text form
filename Show File Names in the trace
focuschange Show the Windows thread focus change events in the trace
hardfault Show hard fault statistics by process and file.
marks Show Marks Information
pagefault Show page fault information in the trace
perfctrs Show process performance counters.
pnp Show PnP events in the trace
prefetch Show Prefetch Information
process Show process, thread, image information
profile Show Sampled profiler data
readyBoot Show ReadyBoot statistics
registry Show Registry Access Statistics
services Show service status information
shutdown Show shutdown statistics
stack Show Stack Information
suspend Show Suspend Transition Information
sysconfig Show System Configuration
tracestats Show Trace Statistics
winlogon Show Winlogon events in the trace
xperf -help <action> [<action> ...] for detailed help
If no action is present, dumper will be invoked.
Since this all started with DPC latency, let’s try out that dpcisr action, which will “Show DPC/ISR Statistics” and see what it has:
C:\xperf>xperf -I \kernel.etl -symbols verbose -a dpcisr
xperf: Using symbol path: srv*c:\DownstreamStore*https://msdl.microsoft.com/download/symbols
xperf: Using executable path: srv*c:\DownstreamStore*https://msdl.microsoft.com/download/symbols
xperf: Using SymCache path: c:\DownstreamStore
--------------------------
DPC Info
--------------------------
CPU Usage Summing By Module For the Whole Trace
CPU Usage from 0 us to 24682000 us:
CPU 0 Usage CPU 1 Usage
usec % usec % Module
248 0.00 0 0.00 CLASSPNP.SYS
31 0.00 0 0.00 HTTP.sys
562 0.00 0 0.00 NETIO.SYS
17 0.00 0 0.00 Ntfs.sys
5121 0.02 0 0.00 USBPORT.SYS
273 0.00 0 0.00 afd.sys
16752 0.07 135 0.00 ataport.SYS
101 0.00 36 0.00 b57nd60x.sys
1 0.00 0 0.00 fltmgr.sys
5 0.00 0 0.00 hal.dll
3851 0.02 0 0.00 i8042prt.sys
14 0.00 0 0.00 luafv.sys
981815 3.98 0 0.00 ndis.sys
239 0.00 0 0.00 netbt.sys
2364 0.01 227 0.00 ntkrnlpa.exe
37360 0.15 0 0.00 portcls.sys
119 0.00 103 0.00 rassstp.sys
317 0.00 0 0.00 rdbss.sys
27 0.00 17 0.00 srv.sys
4 0.00 0 0.00 srvnet.sys
62926 0.25 49358 0.20 tcpip.sys
5054 0.02 0 0.00 usbhub.sys
6 0.00 0 0.00 watchdog.sys
Total = 43599
Elapsed Time, > 0 usecs AND <= 1 usecs, 49, or 0.11%
Elapsed Time, > 1 usecs AND <= 2 usecs, 379, or 0.87%
Elapsed Time, > 2 usecs AND <= 4 usecs, 10388, or 23.83%
Elapsed Time, > 4 usecs AND <= 8 usecs, 9765, or 22.40%
Elapsed Time, > 8 usecs AND <= 16 usecs, 7806, or 17.90%
Elapsed Time, > 16 usecs AND <= 32 usecs, 3885, or 8.91%
Elapsed Time, > 32 usecs AND <= 64 usecs, 5375, or 12.33%
Elapsed Time, > 64 usecs AND <= 128 usecs, 5175, or 11.87%
Elapsed Time, > 128 usecs AND <= 256 usecs, 639, or 1.47%
Elapsed Time, > 256 usecs AND <= 512 usecs, 55, or 0.13%
Elapsed Time, > 512 usecs AND <= 1024 usecs, 55, or 0.13%
Elapsed Time, > 1024 usecs AND <= 2048 usecs, 22, or 0.05%
Elapsed Time, > 2048 usecs AND <= 4096 usecs, 6, or 0.01%
Total, 43599
Total = 10 for module CLASSPNP.SYS
Elapsed Time, > 0 usecs AND <= 1 usecs, 2, or 20.00%
Elapsed Time, > 1 usecs AND <= 2 usecs, 3, or 30.00%
Elapsed Time, > 2 usecs AND <= 4 usecs, 0, or 0.00%
Elapsed Time, > 4 usecs AND <= 8 usecs, 0, or 0.00%
Elapsed Time, > 8 usecs AND <= 16 usecs, 0, or 0.00%
Elapsed Time, > 16 usecs AND <= 32 usecs, 0, or 0.00%
Elapsed Time, > 32 usecs AND <= 64 usecs, 5, or 50.00%
Total, 10
Total = 8 for module HTTP.sys
Elapsed Time, > 0 usecs AND <= 1 usecs, 0, or 0.00%
Elapsed Time, > 1 usecs AND <= 2 usecs, 1, or 12.50%
Elapsed Time, > 2 usecs AND <= 4 usecs, 3, or 37.50%
Elapsed Time, > 4 usecs AND <= 8 usecs, 4, or 50.00%
Total, 8
Total = 124 for module NETIO.SYS
Elapsed Time, > 0 usecs AND <= 1 usecs, 0, or 0.00%
Elapsed Time, > 1 usecs AND <= 2 usecs, 0, or 0.00%
Elapsed Time, > 2 usecs AND <= 4 usecs, 57, or 45.97%
Elapsed Time, > 4 usecs AND <= 8 usecs, 61, or 49.19%
Elapsed Time, > 8 usecs AND <= 16 usecs, 5, or 4.03%
Elapsed Time, > 16 usecs AND <= 32 usecs, 1, or 0.81%
Total, 124
Total = 5 for module Ntfs.sys
Elapsed Time, > 0 usecs AND <= 1 usecs, 0, or 0.00%
Elapsed Time, > 1 usecs AND <= 2 usecs, 0, or 0.00%
Elapsed Time, > 2 usecs AND <= 4 usecs, 4, or 80.00%
Elapsed Time, > 4 usecs AND <= 8 usecs, 1, or 20.00%
Total, 5
Total = 481 for module USBPORT.SYS
Elapsed Time, > 0 usecs AND <= 1 usecs, 0, or 0.00%
Elapsed Time, > 1 usecs AND <= 2 usecs, 0, or 0.00%
Elapsed Time, > 2 usecs AND <= 4 usecs, 81, or 16.84%
Elapsed Time, > 4 usecs AND <= 8 usecs, 64, or 13.31%
Elapsed Time, > 8 usecs AND <= 16 usecs, 257, or 53.43%
Elapsed Time, > 16 usecs AND <= 32 usecs, 76, or 15.80%
Elapsed Time, > 32 usecs AND <= 64 usecs, 3, or 0.62%
Total, 481
Total = 44 for module afd.sys
Elapsed Time, > 0 usecs AND <= 1 usecs, 0, or 0.00%
Elapsed Time, > 1 usecs AND <= 2 usecs, 1, or 2.27%
Elapsed Time, > 2 usecs AND <= 4 usecs, 3, or 6.82%
Elapsed Time, > 4 usecs AND <= 8 usecs, 30, or 68.18%
Elapsed Time, > 8 usecs AND <= 16 usecs, 9, or 20.45%
Elapsed Time, > 16 usecs AND <= 32 usecs, 1, or 2.27%
Total, 44
Total = 736 for module ataport.SYS
Elapsed Time, > 0 usecs AND <= 1 usecs, 0, or 0.00%
Elapsed Time, > 1 usecs AND <= 2 usecs, 0, or 0.00%
Elapsed Time, > 2 usecs AND <= 4 usecs, 15, or 2.04%
Elapsed Time, > 4 usecs AND <= 8 usecs, 28, or 3.80%
Elapsed Time, > 8 usecs AND <= 16 usecs, 207, or 28.13%
Elapsed Time, > 16 usecs AND <= 32 usecs, 335, or 45.52%
Elapsed Time, > 32 usecs AND <= 64 usecs, 139, or 18.89%
Elapsed Time, > 64 usecs AND <= 128 usecs, 12, or 1.63%
Total, 736
Total = 50 for module b57nd60x.sys
Elapsed Time, > 0 usecs AND <= 1 usecs, 0, or 0.00%
Elapsed Time, > 1 usecs AND <= 2 usecs, 23, or 46.00%
Elapsed Time, > 2 usecs AND <= 4 usecs, 19, or 38.00%
Elapsed Time, > 4 usecs AND <= 8 usecs, 6, or 12.00%
Elapsed Time, > 8 usecs AND <= 16 usecs, 1, or 2.00%
Elapsed Time, > 16 usecs AND <= 32 usecs, 1, or 2.00%
Total, 50
Total = 1 for module fltmgr.sys
Elapsed Time, > 0 usecs AND <= 1 usecs, 0, or 0.00%
Elapsed Time, > 1 usecs AND <= 2 usecs, 1, or 100.00%
Total, 1
Total = 1 for module hal.dll
Elapsed Time, > 0 usecs AND <= 1 usecs, 0, or 0.00%
Elapsed Time, > 1 usecs AND <= 2 usecs, 0, or 0.00%
Elapsed Time, > 2 usecs AND <= 4 usecs, 0, or 0.00%
Elapsed Time, > 4 usecs AND <= 8 usecs, 1, or 100.00%
Total, 1
Total = 329 for module i8042prt.sys
Elapsed Time, > 0 usecs AND <= 1 usecs, 0, or 0.00%
Elapsed Time, > 1 usecs AND <= 2 usecs, 0, or 0.00%
Elapsed Time, > 2 usecs AND <= 4 usecs, 0, or 0.00%
Elapsed Time, > 4 usecs AND <= 8 usecs, 9, or 2.74%
Elapsed Time, > 8 usecs AND <= 16 usecs, 298, or 90.58%
Elapsed Time, > 16 usecs AND <= 32 usecs, 22, or 6.69%
Total, 329
Total = 5 for module luafv.sys
Elapsed Time, > 0 usecs AND <= 1 usecs, 0, or 0.00%
Elapsed Time, > 1 usecs AND <= 2 usecs, 1, or 20.00%
Elapsed Time, > 2 usecs AND <= 4 usecs, 3, or 60.00%
Elapsed Time, > 4 usecs AND <= 8 usecs, 1, or 20.00%
Total, 5
Total = 32833 for module ndis.sys
Elapsed Time, > 0 usecs AND <= 1 usecs, 0, or 0.00%
Elapsed Time, > 1 usecs AND <= 2 usecs, 178, or 0.54%
Elapsed Time, > 2 usecs AND <= 4 usecs, 9073, or 27.63%
Elapsed Time, > 4 usecs AND <= 8 usecs, 7653, or 23.31%
Elapsed Time, > 8 usecs AND <= 16 usecs, 4082, or 12.43%
Elapsed Time, > 16 usecs AND <= 32 usecs, 1930, or 5.88%
Elapsed Time, > 32 usecs AND <= 64 usecs, 4425, or 13.48%
Elapsed Time, > 64 usecs AND <= 128 usecs, 4727, or 14.40%
Elapsed Time, > 128 usecs AND <= 256 usecs, 627, or 1.91%
Elapsed Time, > 256 usecs AND <= 512 usecs, 55, or 0.17%
Elapsed Time, > 512 usecs AND <= 1024 usecs, 55, or 0.17%
Elapsed Time, > 1024 usecs AND <= 2048 usecs, 22, or 0.07%
Elapsed Time, > 2048 usecs AND <= 4096 usecs, 6, or 0.02%
Total, 32833
Total = 10 for module netbt.sys
Elapsed Time, > 0 usecs AND <= 1 usecs, 0, or 0.00%
Elapsed Time, > 1 usecs AND <= 2 usecs, 0, or 0.00%
Elapsed Time, > 2 usecs AND <= 4 usecs, 0, or 0.00%
Elapsed Time, > 4 usecs AND <= 8 usecs, 0, or 0.00%
Elapsed Time, > 8 usecs AND <= 16 usecs, 0, or 0.00%
Elapsed Time, > 16 usecs AND <= 32 usecs, 10, or 100.00%
Total, 10
Total = 597 for module ntkrnlpa.exe
Elapsed Time, > 0 usecs AND <= 1 usecs, 43, or 7.20%
Elapsed Time, > 1 usecs AND <= 2 usecs, 129, or 21.61%
Elapsed Time, > 2 usecs AND <= 4 usecs, 344, or 57.62%
Elapsed Time, > 4 usecs AND <= 8 usecs, 50, or 8.38%
Elapsed Time, > 8 usecs AND <= 16 usecs, 4, or 0.67%
Elapsed Time, > 16 usecs AND <= 32 usecs, 3, or 0.50%
Elapsed Time, > 32 usecs AND <= 64 usecs, 23, or 3.85%
Elapsed Time, > 64 usecs AND <= 128 usecs, 1, or 0.17%
Total, 597
Total = 2087 for module portcls.sys
Elapsed Time, > 0 usecs AND <= 1 usecs, 0, or 0.00%
Elapsed Time, > 1 usecs AND <= 2 usecs, 0, or 0.00%
Elapsed Time, > 2 usecs AND <= 4 usecs, 1, or 0.05%
Elapsed Time, > 4 usecs AND <= 8 usecs, 216, or 10.35%
Elapsed Time, > 8 usecs AND <= 16 usecs, 675, or 32.34%
Elapsed Time, > 16 usecs AND <= 32 usecs, 1076, or 51.56%
Elapsed Time, > 32 usecs AND <= 64 usecs, 119, or 5.70%
Total, 2087
Total = 100 for module rassstp.sys
Elapsed Time, > 0 usecs AND <= 1 usecs, 0, or 0.00%
Elapsed Time, > 1 usecs AND <= 2 usecs, 37, or 37.00%
Elapsed Time, > 2 usecs AND <= 4 usecs, 62, or 62.00%
Elapsed Time, > 4 usecs AND <= 8 usecs, 1, or 1.00%
Total, 100
Total = 99 for module rdbss.sys
Elapsed Time, > 0 usecs AND <= 1 usecs, 0, or 0.00%
Elapsed Time, > 1 usecs AND <= 2 usecs, 0, or 0.00%
Elapsed Time, > 2 usecs AND <= 4 usecs, 87, or 87.88%
Elapsed Time, > 4 usecs AND <= 8 usecs, 8, or 8.08%
Elapsed Time, > 8 usecs AND <= 16 usecs, 4, or 4.04%
Total, 99
Total = 13 for module srv.sys
Elapsed Time, > 0 usecs AND <= 1 usecs, 0, or 0.00%
Elapsed Time, > 1 usecs AND <= 2 usecs, 1, or 7.69%
Elapsed Time, > 2 usecs AND <= 4 usecs, 8, or 61.54%
Elapsed Time, > 4 usecs AND <= 8 usecs, 4, or 30.77%
Total, 13
Total = 2 for module srvnet.sys
Elapsed Time, > 0 usecs AND <= 1 usecs, 0, or 0.00%
Elapsed Time, > 1 usecs AND <= 2 usecs, 1, or 50.00%
Elapsed Time, > 2 usecs AND <= 4 usecs, 1, or 50.00%
Total, 2
Total = 4998 for module tcpip.sys
Elapsed Time, > 0 usecs AND <= 1 usecs, 1, or 0.02%
Elapsed Time, > 1 usecs AND <= 2 usecs, 0, or 0.00%
Elapsed Time, > 2 usecs AND <= 4 usecs, 48, or 0.96%
Elapsed Time, > 4 usecs AND <= 8 usecs, 1242, or 24.85%
Elapsed Time, > 8 usecs AND <= 16 usecs, 2179, or 43.60%
Elapsed Time, > 16 usecs AND <= 32 usecs, 421, or 8.42%
Elapsed Time, > 32 usecs AND <= 64 usecs, 660, or 13.21%
Elapsed Time, > 64 usecs AND <= 128 usecs, 435, or 8.70%
Elapsed Time, > 128 usecs AND <= 256 usecs, 12, or 0.24%
Total, 4998
Total = 1060 for module usbhub.sys
Elapsed Time, > 0 usecs AND <= 1 usecs, 0, or 0.00%
Elapsed Time, > 1 usecs AND <= 2 usecs, 0, or 0.00%
Elapsed Time, > 2 usecs AND <= 4 usecs, 579, or 54.62%
Elapsed Time, > 4 usecs AND <= 8 usecs, 386, or 36.42%
Elapsed Time, > 8 usecs AND <= 16 usecs, 85, or 8.02%
Elapsed Time, > 16 usecs AND <= 32 usecs, 9, or 0.85%
Elapsed Time, > 32 usecs AND <= 64 usecs, 1, or 0.09%
Total, 1060
Total = 6 for module watchdog.sys
Elapsed Time, > 0 usecs AND <= 1 usecs, 3, or 50.00%
Elapsed Time, > 1 usecs AND <= 2 usecs, 3, or 50.00%
Total, 6
All Module = 43599, Total = 43599, EQUAL
--------------------------
Usage From 0 ms to 24682 ms, Summing In 1 second intervals. Intervals=25
CPU 0 Usage CPU 1 Usage
Start (ms) End (ms) (usec) % (usec) %
0-1000 : 33992, 3.40 897, 0.09
1000-2000 : 24437, 2.44 1332, 0.13
2000-3000 : 42317, 4.23 4510, 0.45
3000-4000 : 40179, 4.02 1757, 0.18
4000-5000 : 34190, 3.42 988, 0.10
5000-6000 : 19434, 1.94 2066, 0.21
6000-7000 : 25339, 2.53 2618, 0.26
7000-8000 : 46758, 4.68 1691, 0.17
8000-9000 : 81696, 8.17 1998, 0.20
9000-10000 : 77932, 7.79 1500, 0.15
10000-11000 : 64336, 6.43 1684, 0.17
11000-12000 : 45099, 4.51 2311, 0.23
12000-13000 : 59469, 5.95 1890, 0.19
13000-14000 : 44035, 4.40 2393, 0.24
14000-15000 : 50393, 5.04 2455, 0.25
15000-16000 : 71508, 7.15 1694, 0.17
16000-17000 : 56853, 5.69 2054, 0.21
17000-18000 : 63219, 6.32 4046, 0.40
18000-19000 : 62428, 6.24 4742, 0.47
19000-20000 : 33793, 3.38 1134, 0.11
20000-21000 : 28147, 2.81 759, 0.08
21000-22000 : 30630, 3.06 640, 0.06
22000-23000 : 33294, 3.33 710, 0.07
23000-24000 : 26121, 2.61 1819, 0.18
24000-24682 : 21608, 3.17 2177, 0.32
--------------------------
Interrupt Info
--------------------------
CPU Usage Summing By Module For the Whole Trace
CPU Usage from 0 us to 24682000 us:
CPU 0 Usage CPU 1 Usage
usec % usec % Module
10420 0.04 0 0.00 USBPORT.SYS
46437 0.19 0 0.00 VIDEOPRT.SYS
125 0.00 0 0.00 acpi.sys
7657 0.03 0 0.00 ataport.SYS
8722 0.04 0 0.00 i8042prt.sys
72940 0.30 0 0.00 ndis.sys
13633 0.06 0 0.00 portcls.sys
Total = 48319
Elapsed Time, > 0 usecs AND <= 1 usecs, 0, or 0.00%
Elapsed Time, > 1 usecs AND <= 2 usecs, 12026, or 24.89%
Elapsed Time, > 2 usecs AND <= 4 usecs, 24954, or 51.64%
Elapsed Time, > 4 usecs AND <= 8 usecs, 9693, or 20.06%
Elapsed Time, > 8 usecs AND <= 16 usecs, 1611, or 3.33%
Elapsed Time, > 16 usecs AND <= 32 usecs, 29, or 0.06%
Elapsed Time, > 32 usecs AND <= 64 usecs, 6, or 0.01%
Total, 48319
Total = 2256 for module USBPORT.SYS
Elapsed Time, > 0 usecs AND <= 1 usecs, 0, or 0.00%
Elapsed Time, > 1 usecs AND <= 2 usecs, 0, or 0.00%
Elapsed Time, > 2 usecs AND <= 4 usecs, 602, or 26.68%
Elapsed Time, > 4 usecs AND <= 8 usecs, 1556, or 68.97%
Elapsed Time, > 8 usecs AND <= 16 usecs, 97, or 4.30%
Elapsed Time, > 16 usecs AND <= 32 usecs, 0, or 0.00%
Elapsed Time, > 32 usecs AND <= 64 usecs, 1, or 0.04%
Total, 2256
Total = 20976 for module VIDEOPRT.SYS
Elapsed Time, > 0 usecs AND <= 1 usecs, 0, or 0.00%
Elapsed Time, > 1 usecs AND <= 2 usecs, 12026, or 57.33%
Elapsed Time, > 2 usecs AND <= 4 usecs, 7821, or 37.29%
Elapsed Time, > 4 usecs AND <= 8 usecs, 1081, or 5.15%
Elapsed Time, > 8 usecs AND <= 16 usecs, 43, or 0.20%
Elapsed Time, > 16 usecs AND <= 32 usecs, 1, or 0.00%
Elapsed Time, > 32 usecs AND <= 64 usecs, 4, or 0.02%
Total, 20976
Total = 11 for module acpi.sys
Elapsed Time, > 0 usecs AND <= 1 usecs, 0, or 0.00%
Elapsed Time, > 1 usecs AND <= 2 usecs, 0, or 0.00%
Elapsed Time, > 2 usecs AND <= 4 usecs, 0, or 0.00%
Elapsed Time, > 4 usecs AND <= 8 usecs, 0, or 0.00%
Elapsed Time, > 8 usecs AND <= 16 usecs, 11, or 100.00%
Total, 11
Total = 811 for module ataport.SYS
Elapsed Time, > 0 usecs AND <= 1 usecs, 0, or 0.00%
Elapsed Time, > 1 usecs AND <= 2 usecs, 0, or 0.00%
Elapsed Time, > 2 usecs AND <= 4 usecs, 0, or 0.00%
Elapsed Time, > 4 usecs AND <= 8 usecs, 225, or 27.74%
Elapsed Time, > 8 usecs AND <= 16 usecs, 574, or 70.78%
Elapsed Time, > 16 usecs AND <= 32 usecs, 12, or 1.48%
Total, 811
Total = 1178 for module i8042prt.sys
Elapsed Time, > 0 usecs AND <= 1 usecs, 0, or 0.00%
Elapsed Time, > 1 usecs AND <= 2 usecs, 0, or 0.00%
Elapsed Time, > 2 usecs AND <= 4 usecs, 0, or 0.00%
Elapsed Time, > 4 usecs AND <= 8 usecs, 905, or 76.83%
Elapsed Time, > 8 usecs AND <= 16 usecs, 260, or 22.07%
Elapsed Time, > 16 usecs AND <= 32 usecs, 12, or 1.02%
Elapsed Time, > 32 usecs AND <= 64 usecs, 1, or 0.08%
Total, 1178
Total = 20976 for module ndis.sys
Elapsed Time, > 0 usecs AND <= 1 usecs, 0, or 0.00%
Elapsed Time, > 1 usecs AND <= 2 usecs, 0, or 0.00%
Elapsed Time, > 2 usecs AND <= 4 usecs, 16181, or 77.14%
Elapsed Time, > 4 usecs AND <= 8 usecs, 4713, or 22.47%
Elapsed Time, > 8 usecs AND <= 16 usecs, 81, or 0.39%
Elapsed Time, > 16 usecs AND <= 32 usecs, 1, or 0.00%
Total, 20976
Total = 2111 for module portcls.sys
Elapsed Time, > 0 usecs AND <= 1 usecs, 0, or 0.00%
Elapsed Time, > 1 usecs AND <= 2 usecs, 0, or 0.00%
Elapsed Time, > 2 usecs AND <= 4 usecs, 350, or 16.58%
Elapsed Time, > 4 usecs AND <= 8 usecs, 1213, or 57.46%
Elapsed Time, > 8 usecs AND <= 16 usecs, 545, or 25.82%
Elapsed Time, > 16 usecs AND <= 32 usecs, 3, or 0.14%
Total, 2111
All Module = 48319, Total = 48319, EQUAL
--------------------------
Usage From 0 ms to 24682 ms, Summing In 1 second intervals. Intervals=25
CPU 0 Usage CPU 1 Usage
Start (ms) End (ms) (usec) % (usec) %
0-1000 : 5820, 0.58 0, 0.00
1000-2000 : 3686, 0.37 0, 0.00
2000-3000 : 6472, 0.65 0, 0.00
3000-4000 : 5410, 0.54 0, 0.00
4000-5000 : 4638, 0.46 0, 0.00
5000-6000 : 2420, 0.24 0, 0.00
6000-7000 : 2793, 0.28 0, 0.00
7000-8000 : 5988, 0.60 0, 0.00
8000-9000 : 12071, 1.21 0, 0.00
9000-10000 : 12461, 1.25 0, 0.00
10000-11000 : 9816, 0.98 0, 0.00
11000-12000 : 8206, 0.82 0, 0.00
12000-13000 : 8926, 0.89 0, 0.00
13000-14000 : 6189, 0.62 0, 0.00
14000-15000 : 7649, 0.76 0, 0.00
15000-16000 : 9613, 0.96 0, 0.00
16000-17000 : 8431, 0.84 0, 0.00
17000-18000 : 7618, 0.76 0, 0.00
18000-19000 : 7212, 0.72 0, 0.00
19000-20000 : 4813, 0.48 0, 0.00
20000-21000 : 3925, 0.39 0, 0.00
21000-22000 : 4557, 0.46 0, 0.00
22000-23000 : 5169, 0.52 0, 0.00
23000-24000 : 3489, 0.35 0, 0.00
24000-24682 : 2552, 0.37 0, 0.00
Distribution of number of 2000 ms intervals w.r.t. DPC/ISR usage:
CPU 0 CPU 1
DPC/ISR Usage % DPC ISR Combined DPC ISR Combined
>= 0 AND <= 1 0 12 0 13 13 13
> 1 AND <= 5 8 1 7 0 0 0
> 5 AND <= 10 5 0 6 0 0 0
> 10 AND <= 20 0 0 0 0 0 0
> 20 AND <= 40 0 0 0 0 0 0
> 40 AND <= 60 0 0 0 0 0 0
> 60 AND <= 80 0 0 0 0 0 0
> 80 AND <= 100 0 0 0 0 0 0
---
Total: 13 13 13 13 13 13
Which is a pretty nice summary of all the DPCs and ISRs that ran during the data collection period and how long they ran for.
I like XPerf a lot and it’s something we plan to use in WDF to collect data around specific performance scenarios. In particular its ability to tie system performance data together with custom ETW events logged by components (like, say, UMDF) gives a very nice way to see how the parts of an end-to-end performance scenario break down temporarily and also to see how the scenario either causes system activity or is impacted by system activity.
I just wish I could get the symbols working .
Comments
Anonymous
October 06, 2008
PingBack from http://www.easycoded.com/measuring-dpc-time/Anonymous
February 28, 2009
Hi Peter, Glad to see you like xperf - there is a lot of power built into that little tool :) If you still have trouble getting your symbols to work, you can get support on it at the public WPT forum hosted at http://social.msdn.microsoft.com/Forums/en-US/wptk_v4/threads. Cheers, MichaelAnonymous
October 08, 2010
The comment has been removedAnonymous
February 08, 2011
It's interesting but I wonder how it works. I wanna know how to get the cpu time slice of a given or some processes just because I'm working on a tiny project and I need to calculate the cpu usage of some processes periodically, are there any APIs/performance databases that would allow me to do this? Thanks in advance.Anonymous
June 10, 2011
The comment has been removedAnonymous
July 27, 2011
Hi Cna someone help me? i need to check that in window of 10ms DPC duration is no more than 4ms How can i check it in xperf?
