Process Monitor for Dynamic Malware Analysis
Sysinternals Process Monitor is a powerful tool for investigating and troubleshooting application issues, as well as malware forensics and analysis tasks.
Process Monitor lets you ‘peek under the hood’: Display files, registry, network and image loading activities in real time; all of the output can be exported to an external file for later viewing. The tool is using a device driver and Event Tracing for Windows (ETW) for tracing these activities.
Although running the tool is straightforward, it’s a somewhat challenging tool to use because you are quickly overwhelmed by the amount of data presented to you.
In this post I’m going to attempt explaining how to use Process Monitor effectively for dynamic malware analysis, and provide a script that I wrote for automating these activities.
This post assumes that you have a basic knowledge of the Process Monitor. If you don’t, here are some great resources to get you up to speed:
· https://channel9.msdn.com/Shows/Defrag-Tools/Defrag-Tools-3-Process-Monitor
· https://channel9.msdn.com/Shows/Defrag-Tools/Defrag-Tools-4-Process-Monitor
Process Monitor Filtering
When you run the tool it starts to capture system activity and display it as a time-ordered list. You can see the start time, the process name and it’s PID, operation, path and additional information.
Even on an idle system we can see hundreds and even thousands of events recorded in a very short period of time, therefore we have the need to effectively filter the output.
Fortunately, Process Monitor has built-in powerful filtering capabilities, which permits you to specify various conditions and decide which records should be displayed.
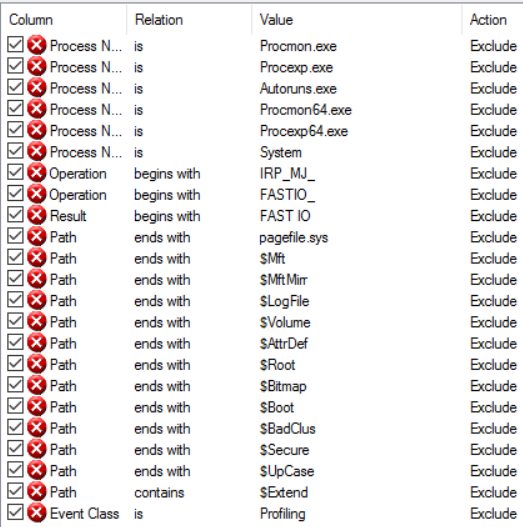
You can define the filters by pressing CTRL+L in Process Monitor or through the Filter > Filter… menu option. As you can see, the tool comes with several pre-defined filters to eliminate a small set of common Windows and Sysinternals Tools events:
But even with these default filters there is too much noise in the log file. Based on my experience I have created a filter to display only “interesting” events when investigating malware activity.
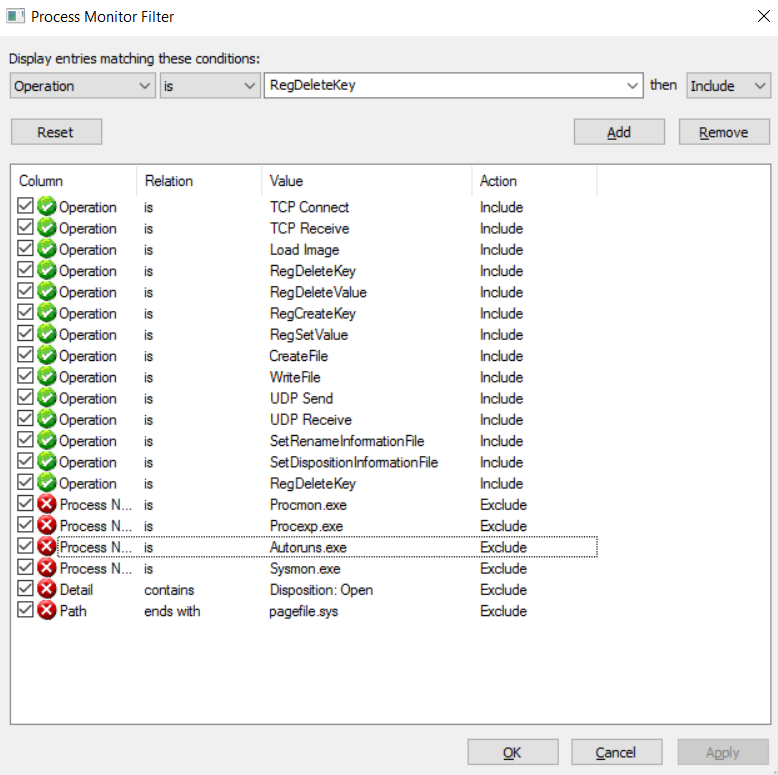
These are the filters I like to use when doing dynamic malware analysis:
First, I've added what needs to be included in from malware analyses perspective:
Included Filters:
· TCP/UDP Send and Receive - any connections that malware may try to use while it’s running
· Load Image – DLL/Executable loading
· Create File – new files being created
· Write/ Delete/Rename File – any changes to files
· Registry activities – Run entries used for malware persistence
Then, I've excluded noisy events that are usually not relevant for malware analyses:
Excluded Filters:
· Procmon/Procmon64/Autoruns/Sysmon : These will exclude any events related to the Sysinternals tools
· Disposition: Open – used to filter any call for create file used to open a file rather than actually creating a file (See here: https://msdn.microsoft.com/en-us/library/windows/desktop/aa363858%28v=vs.85%29.aspx)
· Page File – In my opinion, the page file is less/not relevant when doing malware analysis
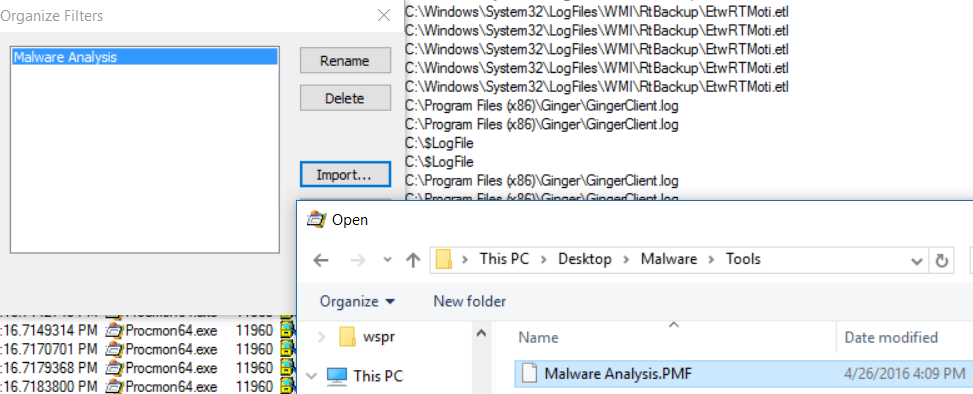
You can download the filter I'm using from GitHub:
https://raw.githubusercontent.com/MotiBa/ProcessMonitorAnalyzeMalware/master/Malware%20Analysis.PMF
Then load it to Process Monitor using Filter->Organize Filters menu and then import
One thing you should remember is that malware can disguise itself as other processes, i.e. the Sysinternals tool, and by using my filter you may not notice such malicious activities.
Analyze-ProcmonLog Script
Analyze-ProcmonLog is a PowerShell-based script I wrote to help with the analysis of Process Monitor logs. Analyze-ProcmonLog simplifies the analysis of Process Monitor XML log file, and gives you a summary report for high fidelity events extracted from the log.
The report contains sections dedicated to Processes Created, File Activity, Registry Activity, Network Traffic and Unique Hosts
Using Analyze-ProcmonLog requires only Sysinternals procmon.exe (or procmon64.exe) to run. It needs no pre-filtering (though it would greatly help) as it contains numerous white-list items to cut unwanted noise from system activity logs.
Usage:
Analyze-ProcmonLog -ProcmonXmlFile <Path to XML File>
For example:
Analyze-ProcmonLog -ProcmonXmlFile "C:\Users\motib\Desktop\Malware\Tesla\Logfile.XML"
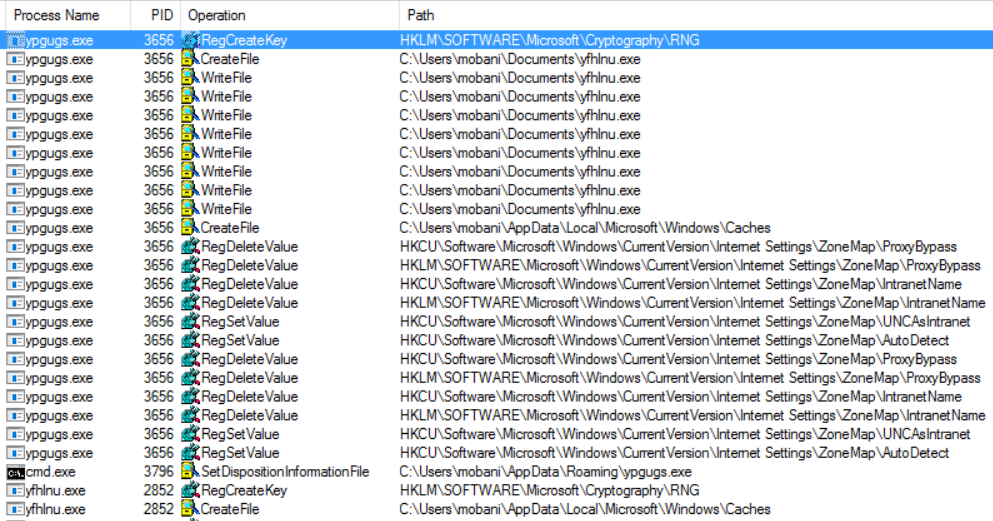
Here is a real-world summary of Process Monitor log with Telsa ransomware's initial infection captured in a lab environment:
In the process created table we can see the ypgugs.exe process created and running the yfhlnu process. We can also see that the malware is invoking the vssadmin tool to delete all shadow copies (common behavior for ransomware)
Processes Created:
==================
Time Parent Process Process
---- -------------- -------
9:36 PM svchost.exe (888) consent.exe 888 330 01C01F68 (3316)
9:36 PM Explorer.EXE (2152) "C:\Users\mobani\AppData\Roaming\ypgugs.exe" (2248)
9:37 PM ypgugs.exe (2248) "C:\Users\mobani\AppData\Roaming\ypgugs.exe" (3656)
9:37 PM ypgugs.exe (3656) C:\Users\mobani\Documents\yfhlnu.exe (3732)
9:37 PM ypgugs.exe (3656) "C:\Windows\system32\cmd.exe" /c DEL C:\Users\mobani\AppData\Roaming\ypgugs.exe >> NUL (3796)
9:37 PM csrss.exe (444) \??\C:\Windows\system32\conhost.exe (3812)
9:37 PM yfhlnu.exe (3732) C:\Users\mobani\Documents\yfhlnu.exe (2852)
9:37 PM yfhlnu.exe (2852) "C:\Windows\System32\vssadmin.exe" Delete Shadows /All /Quiet (968)
9:37 PM csrss.exe (444) \??\C:\Windows\system32\conhost.exe (3628)
9:37 PM services.exe (540) C:\Windows\system32\vssvc.exe (1940)
9:40 PM services.exe (540) C:\Windows\system32\sc.exe start w32time task_started (1984)
9:40 PM csrss.exe (392) \??\C:\Windows\system32\conhost.exe (1304)
9:43 PM yfhlnu.exe (2852) "C:\Windows\system32\NOTEPAD.EXE" C:\Users\mobani\Desktop\RECOVERdixal.txt (2480)
9:43 PM iexplore.exe (2764) "C:\Program Files\Internet Explorer\iexplore.exe" SCODEF:2764 CREDAT:14337 (3024)
9:43 PM yfhlnu.exe (2852) "C:\Windows\System32\vssadmin.exe" Delete Shadows /All /Quiet (3536)
9:43 PM csrss.exe (444) \??\C:\Windows\system32\conhost.exe (3672)
9:43 PM services.exe (540) C:\Windows\system32\vssvc.exe (2684)
9:43 PM yfhlnu.exe (2852) "C:\Windows\system32\cmd.exe" /c DEL C:\Users\mobani\DOCUME~1\yfhlnu.exe >> NUL (4064)
9:43 PM csrss.exe (444) \??\C:\Windows\system32\conhost.exe (2112)
9:43 PM svchost.exe (888) consent.exe 888 328 01C020C0 (2460)
9:43 PM Explorer.EXE (2152) "C:\Windows\System32\cmd.exe" /C "E:\Tools\ExportLogsFromEnvironment.cmd" (932)
9:43 PM csrss.exe (444) \??\C:\Windows\system32\conhost.exe (2316)
In File Created table we can see the binary dropping of yfhlnu.exe to the user’s documents folder
Files Created:
==================
Time Process Path
---- ------- ----
9:37 PM ypgugs.exe C:\Users\mobani\Documents\yfhlnu.exe
9:37 PM yfhlnu.exe C:\Users\mobani\AppData\Roaming\Microsoft\Windows\Cookies\mobani@nlhomegarden[1].txt
9:37 PM yfhlnu.exe C:\Users\mobani\AppData\Local\Microsoft\Windows\Temporary Internet Files\Content.IE5\ROUMP04G\suspendedpage[1].htm
9:40 PM services.exe C:\Windows\System32\LogFiles\Scm\d04538ee-5fc9-4d09-b32e-19f854c72043
9:40 PM services.exe C:\Windows\System32\LogFiles\Scm\d04538ee-5fc9-4d09-b32e-19f854c72043
9:43 PM iexplore.exe C:\Users\mobani\AppData\Local\Microsoft\Internet Explorer\Recovery\Active\{985BCC71-EECB-11E5-8BD9-00155D000309}.dat
9:43 PM iexplore.exe C:\Users\mobani\AppData\Local\Temp\~DFACC2FEDD5AC80891.TMP
9:43 PM yfhlnu.exe C:\Users\mobani\AppData\Local\Microsoft\Windows\Temporary Internet Files\Content.IE5\ROUMP04G\suspendedpage[1].htm
9:43 PM Explorer.EXE C:\Users\mobani\AppData\Roaming\Microsoft\Windows\Recent\RECOVERdixal.lnk
Network Traffic table (truncated)
Network Traffic:
==================
Time Protocol Process Path
---- -------- ------- ----
9:36 PM TCP svchost.exe Win7-PC.vforest.lab:49249 -> win-9vq32olv707.vforest.lab:5985
9:36 PM TCP svchost.exe Win7-PC.vforest.lab:49265 -> win-9vq32olv707.vforest.lab:5985
9:36 PM TCP svchost.exe Win7-PC.vforest.lab:49265 -> win-9vq32olv707.vforest.lab:5985
9:36 PM TCP svchost.exe Win7-PC.vforest.lab:49265 -> win-9vq32olv707.vforest.lab:5985
9:36 PM TCP svchost.exe Win7-PC.vforest.lab:49253 -> win-9vq32olv707.vforest.lab:5985
9:36 PM TCP svchost.exe Win7-PC.vforest.lab:49253 -> win-9vq32olv707.vforest.lab:5985
9:36 PM TCP svchost.exe Win7-PC.vforest.lab:49253 -> win-9vq32olv707.vforest.lab:5985
9:36 PM TCP svchost.exe Win7-PC.vforest.lab:49257 -> win-9vq32olv707.vforest.lab:5985
9:36 PM TCP svchost.exe Win7-PC.vforest.lab:49257 -> win-9vq32olv707.vforest.lab:5985
9:36 PM TCP svchost.exe Win7-PC.vforest.lab:49257 -> win-9vq32olv707.vforest.lab:5985
In Unique Hosts, we can see that many servers are from secureserver.net domain (malware C&C)
Unique Hosts:
==================
win-9vq32olv707.vforest.lab
WIN2008-DC
bzq-25-69-162.cust.bezeqint.net
a23-34-235-27.deploy.static.akamaitechnologies.com
bzq-218-31-176.cablep.bezeqint.net
a23-34-230-70.deploy.static.akamaitechnologies.com
bzq-218-31-177.cablep.bezeqint.net
ip-107-180-50-183.ip.secureserver.net
ip-107-180-50-210.ip.secureserver.net
daryl.asoshared.com
accord.host-care.com
192.185.35.88
ip-107-180-4-11.ip.secureserver.net
The goal of Analyze-Procmonlog is to provide very quick and simple answers to your questions, either for a more in-depth analysis of an infected system, a better understanding of a malware's capabilities without static analysis, or to quickly craft network filters to look for (and block) other infections. Which files were created? What MD5s should I scan for? Which network hosts and ports are being used?
The pure text report allows you to quickly see data and copy/paste it to a relevant solution.
Link to script on TechNet gallery: https://gallery.technet.microsoft.com/Analyze-Process-Monitor-9eb95f84


