Automating Trace Analysis
In our last post, we discussed how to examine Media Foundation traces manually, using TextAnalysisTool.NET. This time, we present a few scripts to automate the process and identify problems more quickly.
Getting Started
First, install Perl, GraphViz, and Gnuplot. Then open a command prompt and add Gnuplot to your path. For example:
set PATH=%PATH%;C:\Program Files\gnuplot\binary
The exact path to Gnuplot on your machine might differ. The installers for Perl and GraphViz automatically add the path, so those two applications should already be in your path.
Next, download the following Perl scripts from MSDN Code Gallery:
- ParseTopologies.cmd
- ParseTimestamps.cmd
- ParseDirectShowGraphs.cmd
The scripts in the download package have a .txt file extension. Rename them to have a .cmd extension.
In the following, we assume that a log file was captured using MFTrace and saved to .\mf.log. If you need a refresher on MFTrace, please refer to our previous posts and to MSDN.
Drawing Topologies
Recall that Media Foundation takes various pipeline components (sources, decoders, sinks) and assembles them into a topology. It is hard to visualize a topology just by reading a trace log. A picture of a topology would be much easier to understand. That’s exactly what our first script does: It searches the log for traces that describe the topology, saves these in a format that GraphViz understands, and runs GraphViz to create an image.
Running the script is straightforward:
ParseTopologies.cmd mf.log
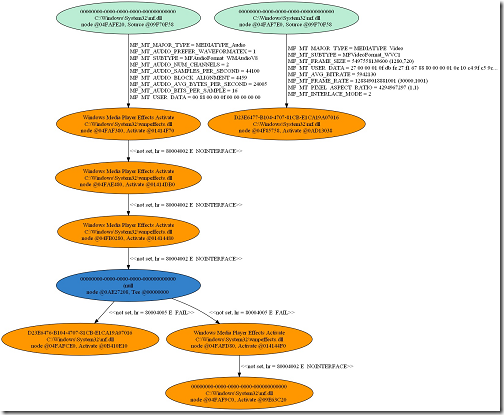
The script creates several images which represent the topology at different stages of topology resolution. The first topology is the input to the Media Session, and often looks like this:
Each node represents a component of the topology. Media types shared by two connected components are displayed along the line of the connection.
The node colors have the following meaning:
Activation objects are like placeholders that have been inserted into the topology in place of the components themselves. As the topology gets resolved, the actual components are instantiated and gradually replace the activation objects:
This topology represents the “ready” state. It contains two branches:
- A video branch, shown on the right. This branch is fairly straightforward. It contains just a source node, a decoder, and a sink node.
- An audio branch, shown on the left. This branch is a bit more complicated. It contains a source node, a decoder, several effects, a tee, another effect, and finally two sink nodes.
Plotting Sample Time Stamps
Just like topologies, time stamps are much simpler to analyze with some visual aid. This is what the second script creates, with the help of Gnuplot.
Again, running the script is straightforward:
ParseTopologies.cmd mf.log [-absolute]
By default, time stamps are plotted as the difference between the time stamp and wall-clock time. If you want to plot time stamps as a function of wall-clock time, add the “-absolute” command-line option.
For playback scenarios, the difference is usually more interesting, as it results in flat graphs when samples flow smoothly (i.e. real time). The “-absolute” option is geared toward transcoding scenarios, where you want the samples flow as fast as possible.
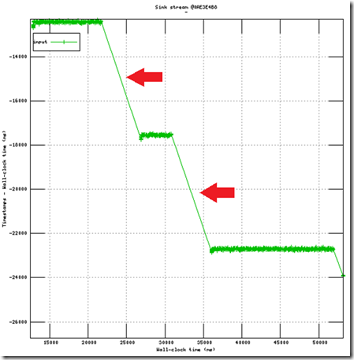
The script plots one graph per component. The time stamps from input samples are plotted in green, and the time stamps from output samples are plotted in blue. The gap between the two gives an idea of the latency of the component. However, tracing adds some latency to the measurements, so the gap should be viewed as an upper bound on the latency.
Here is an example of what you do not want to see in a playback scenario: two major glitches in an otherwise smooth playback.
The script also prints a few statistics at the command prompt about the components in the topology. This can be useful to quickly determine whether some components were not generating samples as they should have.
Drawing DirectShow graphs
Because MFTrace also captures some DirectShow traces, it is also possible to draw DirectShow graphs. Here is the graph for playing a WTV file.
ParseDirectShowGraphs.cmd mf.log
As you can see, WTV playback can be quite involved.
That’s all for now. Next time, we will see how to add custom traces from components or applications to the MFTrace logs. In the meantime, do not hesitate to post comments here, or questions on the Media Foundation forum.
Comments
- Anonymous
November 04, 2012
Hi, is there any way to trace the sample data from MF Source to MFT decoder?


