AzureTools – The Diagnostic Utility used by the Windows Azure Developer Support Team
Getting AzureTools
Direct Download Link - https://dsazure.blob.core.windows.net/azuretools/AzureTools.exe
--- or ---
Downloading from within an Azure VM (*note, this only works on Guest OS Family 2 or later. Guest OS Family 1 includes Powershell v1 which does not support Import-Module or BitsTransfer. For Guest OS Family 1 use the direct download link above)
- RDP to the Azure VM
- Open Powershell
- Copy/Paste and Run the following script
md c:\tools; Import-Module bitstransfer; Start-BitsTransfer https://dsazure.blob.core.windows.net/azuretools/AzureTools.exe c:\tools\AzureTools.exe; c:\tools\AzureTools.exe
The Windows Azure Developer Support team has engineers all over the world who spend significant amounts of time troubleshooting a wide range of issues within Windows Azure PaaS Virtual Machines. Over the last few years this team has developed an in-house utility which provides quick and easy access to the most common troubleshooting tasks and tools. In an effort to provide a better experience for our customers this utility is being released publicly and this blog post will outline how to get the tool and how to use it. The troubleshooting series at https://blogs.msdn.com/b/kwill/archive/2013/08/09/windows-azure-paas-compute-diagnostics-data.aspx will make use of this tool and show different scenarios for how it can be used.
This utility is constantly being developed and improved so keep an eye on this blog post for updates on new features. The utility has an auto-update feature so you will be notified when a new version is available. Also, if you have any suggestions for new features please add a comment.
AzureTools is primarily intended to be run from within an RDP session in an Azure PaaS Virtual Machine, but there are some useful functions that can also be used on any machine outside of the Azure environment.
<Update September 5, 2013>
Version 1.5.0.0
Added following tools:
- PerfView
- Remote Tools for Visual Studio 2012 Update 2
- Table2csv
Adding the following to Utils tab:
- Table2csv
Misc Bug Fixes
</Update September 5, 2013>
<Update October 29, 2013>
Version 1.6.0.0
Added following tools:
- DebugDiag v2 (replaces DebugDiag v1.2)
Adding the following to Misc Tools:
- Storage REST API
- Windows Azure Service Management REST API
- String Encoding
Misc Bug Fixes
</Update October 29, 2013>
Downloadable Tools
The primary use of AzureTools is to quickly and easily get the most common troubleshooting tools (ie. Netmon, Sysinternals Suite, etc) onto an Azure VM. The IE enhanced internet security configuration on Azure VMs makes it cumbersome to search for and download tools from the internet, but with AzureTools you can easily double-click on a tool and have it automatically download and extract/install. Several of these tools are also useful on your on-premise machines.
Tools List
DebugDiagx64 - The Debug Diagnostic Tool (DebugDiag) is designed to assist in troubleshooting issues such as hangs, slow performance, memory leaks or fragmentation, and crashes in any user-mode process. The tool includes additional debugging scripts focused on Internet Information Services (IIS) applications, web data access components, COM+ and related Microsoft technologies. This is used frequently in Azure to setup monitoring to capture a problem that happens infrequently.
DebugView – DebugView is an application that lets you monitor debug output on your local system, or any computer on the network that you can reach via TCP/IP. It is capable of displaying both kernel-mode and Win32 debug output, so you don't need a debugger to catch the debug output your applications or device drivers generate, nor do you need to modify your applications or drivers to use non-standard debug output APIs. This is used in Azure to monitor the heartbeat output from WindowsAzureGuestAgent in real time. To enable this go to Capture –> Capture Global Win32.
Fiddler4Setup – Fiddler is used to capture, analyze, and manipulate HTTP traffic. This is a vital tool when troubleshooting any web based application and is frequently used in Azure to troubleshoot webroles, Azure Storage, etc.
ILSpy_Master_2.1.0.1603_RTW_Binaries - ILSpy is the open-source .NET assembly browser and decompiler. This allows you to disassemble any .NET assembly and is a quick and easy way to see what a binary on an Azure VM is doing and validate that it is doing what you expect it to do.
PerfView.zip – PerfView is a performance-analysis tool that helps isolate CPU- and memory-related performance issues.
NM34_x64 – Network Monitor (Netmon) is used to capture and analyze network traffic. If you are using Azure you are almost certainly building an application which communicates over the network, and Netmon is vital for troubleshooting the communication between your Azure VM and an external resource.
Psscor4 - Psscor4 is a Windows Debugger extension used to debug .NET Framework 4 applications. If you are using WinDBG to debug a .NET application or dump file then psscor4 is a key debugger extension.
SysinternalsSuite – The Sysinternals Troubleshooting Utilities have been rolled up into a single Suite of tools. This file contains the individual troubleshooting tools and help files. It does not contain non-troubleshooting tools like the BSOD Screen Saver or NotMyFault. The most common utilities to use in an Azure VM is Process Explorer and Process Monitor.
X64 Debuggers And Tools-x64_en-us - Use Debugging Tools for Windows to debug drivers, applications, and services on Windows systems. Debugging Tools for Windows includes a core debugging engine and several tools that provide interfaces to the debugging engine. A Visual Studio extension provides a graphical user interface, as does Windows Debugger (WinDbg). Console Debugger (CDB), NT Symbolic Debugger (NTSD), and Kernel Debugger (KD) provide command line user interfaces. WinDBG is the debugger of choice for most Microsoft support teams and most hard core debuggers and is frequently used in Azure to do live debugging since it is much easier to get onto an Azure VM than a debugger such as Visual Studio.
rtools_setup_x64 - Remote Tools for Visual Studio 2012 enables remote debugging, remote testing, and performance unit testing on computers that don't have Visual Studio installed.
Table2csv - Use this tool from the Utils tab of AzureTools. Converts WAD TSF Files into a CSV file. See below under Utils for more information.
File Transfer
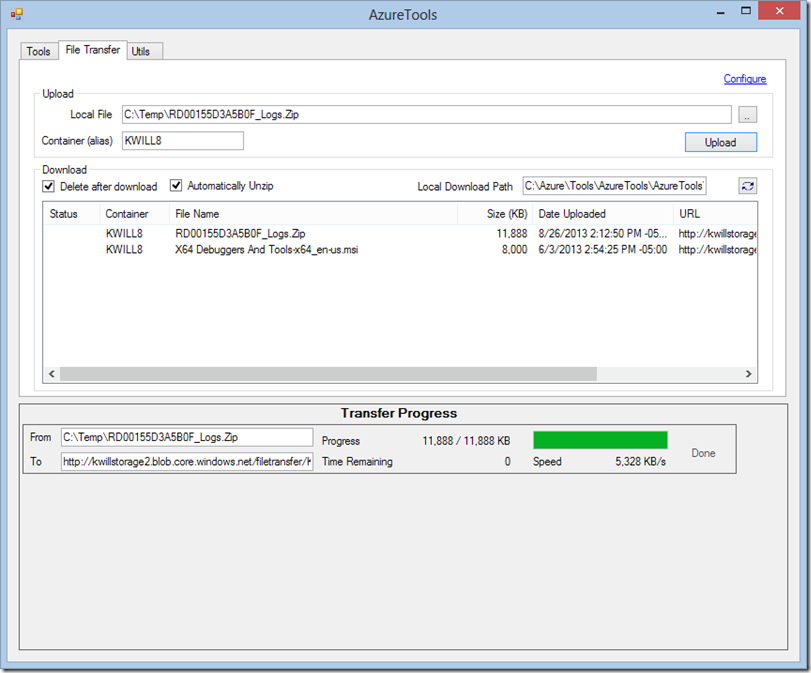
There are several ways to get a file onto and off of an Azure VM while you are troubleshooting, with the easiest being to do a simple Copy/Paste via RDP. However, for very large files this becomes very time consuming and error prone. You could also download one of many free storage explorer tools and configure it, but if you only have one or two files to transfer (ie. a .dmp file you want to analyze later, or a .CAB from the Azure PaaS SDP package) then you spend more time getting the storage explorer tool. AzureTools provides data transfer functionality which uploads or downloads files into and out of blob storage which makes getting files onto or off of an Azure VM very easy and quick.
Utilities
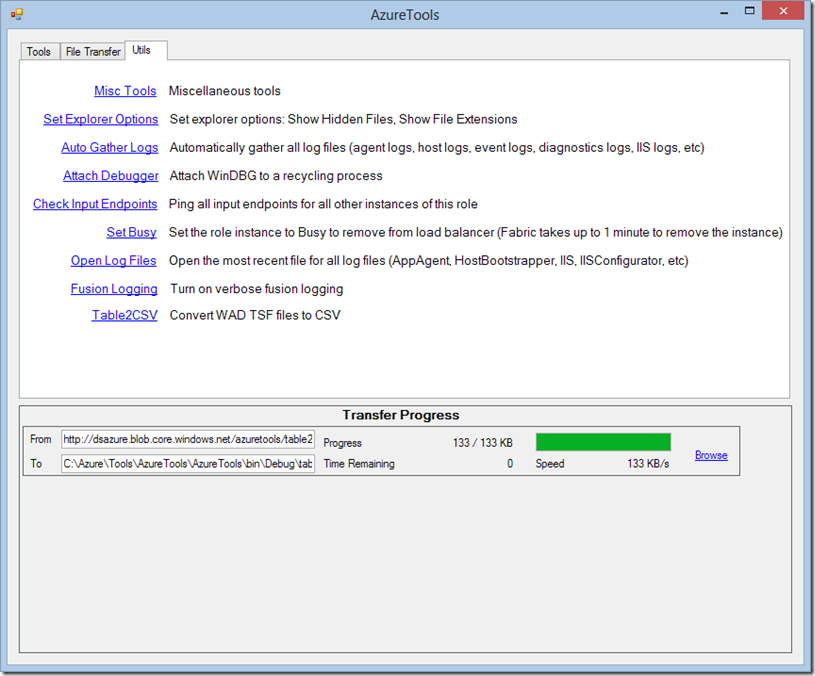
When troubleshooting on an Azure VM you can find yourself repeating the same types of tasks on every VM, such as turning on Fusion Logging or showing File Extensions in Windows Explorer. There are also some tasks that are much easier to achieve programmatically than manually, such as pinging the input endpoints of every role instance in the hosted service to identify which one of them might be encountering issues.
Misc Tools – Miscellaneous tools that require more UI space than can fit here (yes, there are probably better ways to organize this, but I am not a UI designer)…
Set Explorer Options – Change the Windows Explorer options to show Hidden Files and show File Extensions.
Auto Gather Logs – This was the predecessor to the Azure PaaS SDP Package which was recently introduced. It will gather all of the most commonly used log files into a ZIP file which can then be copied off of the Azure VM for data retention or offline analysis. This is especially useful if your production system is down and you need to get it back up and running quickly and you want to grab the log files before rebooting the VM or taking any other remediation steps.
Attach Debugger – This is arguably one of the most useful utilities in AzureTools. This will let you attach a debugger to a process which fails and exits immediately on startup. The most common scenario is a role which is recycling and you want to attach WinDBG to the WaIISHost/WaWorkerHost process, but it crashes too quickly for you to manually attach the debugger. In Azure the normal trick of setting the Image File Execution Options debugger registry key doesn’t work and this Attach Debugger utility is the only consistent way I have found to attach a debugger. To use, first download a debugger (ie. double-click the X64 Debuggers And Tools-x64_en-us tool from the Tools tab), enter the process name you are interested in, click Attach Debugger, and wait for the Azure guest agent to automatically start that process again.
Check Input Endpoints – This will send an HTTP GET to every endpoint of every role and instance in the hosted service that the VM you are RDPed into belongs. Because Azure VMs with input endpoints sit behind a round robin load balancer, if one VM is misbehaving then the problem can look very random from the outside world (ie. 5% of requests from my monitoring site are failing). If you only have a small number of instances then it is not too difficult to RDP to each one and see if it is working correctly, but this technique quickly becomes infeasible. To identify if it is a specific VM which is having problems you can RDP to any VM in that hosted service, run AzureTools, click on Check Input Endpoints and see if a failure is returned from any of them.
Set Busy – This will set the VM you are currently RDPed into to Busy which will remove it from the load balancer rotation. This is useful in a couple scenarios: 1) You are troubleshooting a production service and you don’t want your debugging (ie. breaking into w3wp) to interfere with live traffic to your site, or 2) You want to isolate this VM in order to troubleshoot it without the extra noise of additional unexpected incoming traffic.
Open Log Files – This will open the current log file for all of the log files most commonly used when troubleshooting on an Azure VM (see Windows Azure PaaS Compute Diagnostics Data). This is useful when you are troubleshooting an issue and you don’t quite know where to begin looking so you want to see all of the data without having to go searching for all of it.
Fusion Logging – This turns on or off .NET Fusion Logging verbose output by setting keys under HKEY_LOCAL_MACHINE\SOFTWARE\Microsoft\Fusion [ForceLog=1, LogFailures=1, LogResourceBinds=1, LogPath=<AzureTools startup path>].
Table2csv – Convert Windows Azure Diagnostics TSF files into CSV files. WAD TSF files are the locally cached binary files on an Azure VM where WAD stores diagnostic data prior to sending it to Azure storage. These files can be found at C:\Resources\Directory\{DeploymentID}.{Rolename}.DiagnosticStore\Monitor\Tables.
Misc Tools
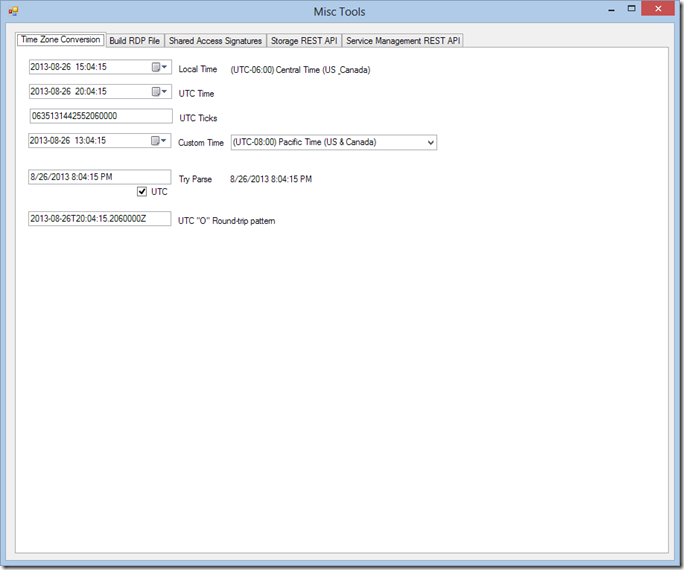
This is a collection of miscellaneous utilities that required more UI space than a simple button/link.
Time Zone Conversion
Use this to quickly convert between different time zones, UTC ticks, and format strings. Because everything in Azure is UTC this functionality is very handy when converting between your local time zone and a time that you see in an Azure log file. The UTC Ticks conversion is handy when searching Windows Azure Diagnostics log tables since they are partitioned based on tick count.
Build RDP File
This will build an RDP file to a specific VM in an Azure deployment. This is handy if you don’t have access to the portal, but you know the URL and role name of the VM that you want to RDP to.
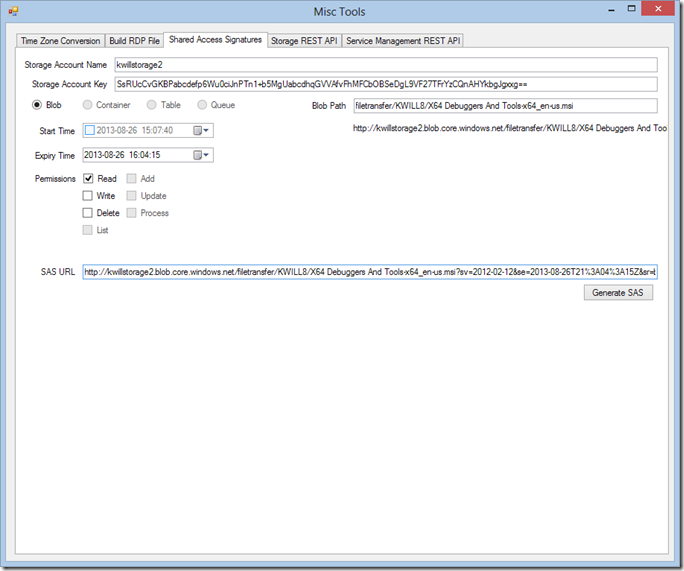
Shared Access Signatures
Still under development for Table and Queue resources. This lets you easily build one-off shared access signatures to blob resources without having to write a bunch of code just to generate a SAS.
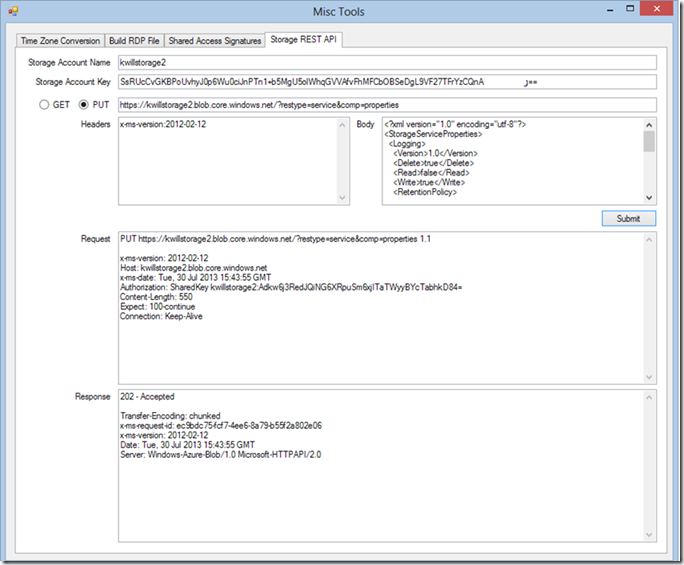
Storage REST API
This will let you build a REST request to the storage API and specify the headers and body. This is particular useful if you want to test different x-ms-versions, troubleshoot storage calls, or test the RETS APIs.
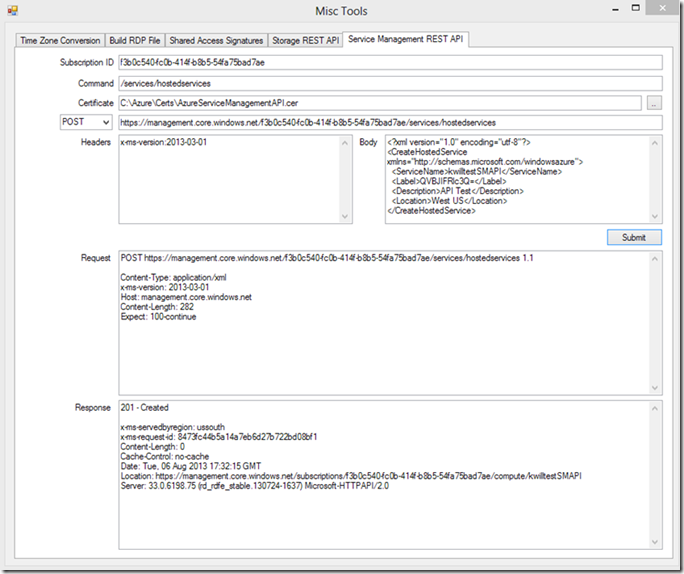
Service Management REST API
Similar to the Storage REST API above, but this targets the service management API.
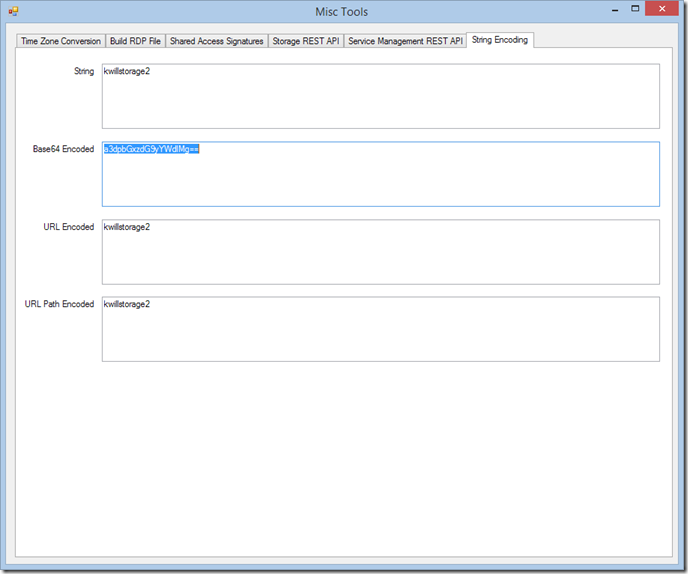
String Encoding
Encode and Decode strings between Base64, URLEncoding, and URLPathEncoding. Useful when making Service Management API calls as most of the APIs require input in the form of Base64 encoded strings.
Comments
Anonymous
January 02, 2014
Starting 1/2/2014 I am getting a store exception saying that AutenticationFailed. Looks like something changed in the backend?Anonymous
January 02, 2014
Thank you for reporting that Ryan. The table ACL had an expiration date for the end of 2013. The expiration date has been updated and everything should be working again.Anonymous
March 19, 2014
Hi, These tools are really useful - thanks for sharing. I noted that the tools are geared towards use on PaaS VMs. While most of the tools will work on regular IaaS VMs, I believe the utilities such as Set Busy and Check Input Endpoints only work with PaaS. While I guess I could write something that replicates this functionality I'm not really a developer - are there any plans to release similar tools for IaaS? This would be really useful for admins such as my self. ThanksAnonymous
March 19, 2014
Vijay, thanks for the comment. In most cases the data doesn't exist on an IaaS VM or the API doesn't exist to perform the command. For your two specific scenarios: Set Busy - PaaS VMs use the RoleEnvironment events to check for role health, but these do not exist in IaaS. IaaS uses endpoint probes to remove an instance from LB rotation, but there isn't really a generic way for a stand alone utility to do this. Check Input Endpoints - PaaS VMs expose the list of all instances via the ServiceRuntime API, but this does not exist in IaaS so there is no way to obtain the list of endpoints to check. Please let me know if there are other ideas for IaaS VMs or thoughts about how to overcome some of the limitations and I will be happy to extend the functionality of the tool.Anonymous
December 16, 2014
I notice that this tool itself appears to have an assembly bind that cannot be resolved: The operation failed. Bind result: hr = 0x80070002. The system cannot find the file specified. Assembly manager loaded from: D:WindowsMicrosoft.NETFramework64v4.0.30319clr.dll Running under executable C:toolsAzureTools.exe --- A detailed error log follows. === Pre-bind state information === LOG: User = WESWorker0vmob LOG: DisplayName = Microsoft.WindowsAzure.ServiceRuntime, Version=2.3.0.0, Culture=neutral, PublicKeyToken=31bf3856ad364e35 (Fully-specified)Anonymous
December 17, 2014
@creature - Do you have a repro environment or more information about the environment you are running in? Loading the ServiceRuntime DLL in a version agnostic way is quite difficult, but I haven't seen that error before. Feel free to contact me at kwill@microsoft.com and I would be happy to work with you to help resolve this.Anonymous
November 14, 2015
Hi There, We have developed a new free tool to assist with the deployment of VMs in to Microsoft Azure Cloud. AVMD by SmiKar Software www.smikar.comAnonymous
May 11, 2017
The comment has been removedAnonymous
April 25, 2019
Awesome tools and appreciate the efforts.

