How to get a dump for a System.Net.WebException using DebugDiag (Debug Diagnostics)
This information is available in the help file as well. For more options please refer to the Help Documentation include with DebugDiag.
Install the latest Debug Diagnostics from https://download.microsoft.com (search for Debug Diagnostics once on that site)
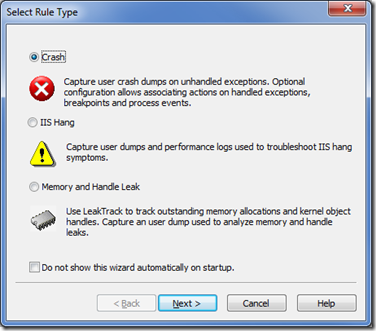
Configure a crash rule for all w3wp.exe processes (if this dialog does not appear simply press the ‘Add Rule…’ button).
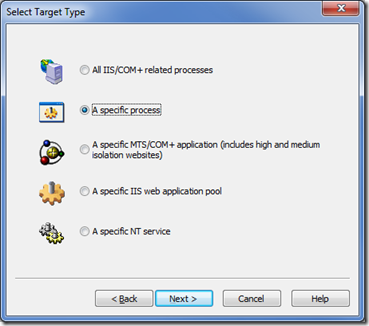
Select ‘A specific process’
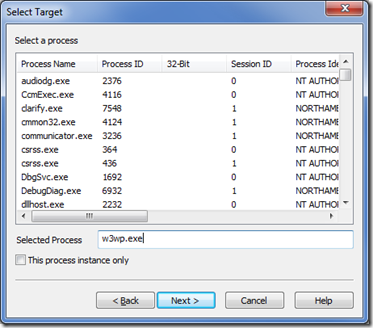
Make sure you DO NOT check ‘This process instance only’ and type in the process we wish to monitor (in this case asp.net is running in w3wp.exe).
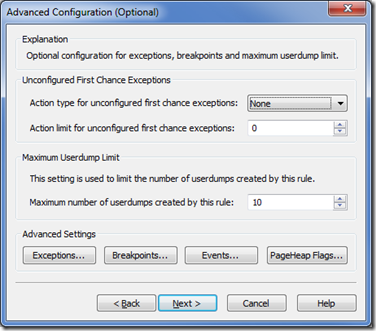
In the ‘Advanced Configuration Dialog’ select the 'Exceptions...’ button at the bottom of this dialog:
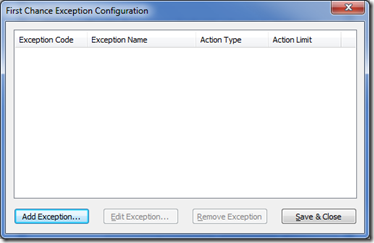
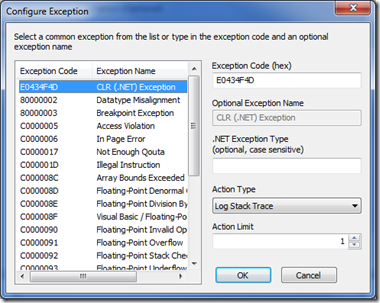
Choose ‘Add Exception…’. Clicking this button will bring up the Configure Exception dialog. Use this to configure actions for a specific type of first chance exception.
In the Configure Exception Dialog, Choose 'CLR (.NET) Exception (NOTE: if debugging the 4.0 Framework
you will need to configure E0434352 as CLR (.Net) Exception code instead of E0434F4D)
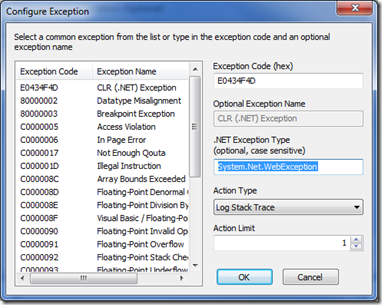
For the 'Net Exception Type' field: (This will only be available when choosing the E0434F4D CLR (.NET) Exception code) You must specify the exact name of the exception in this field. This field is case sensitive. In our case we want System.Net.WebException
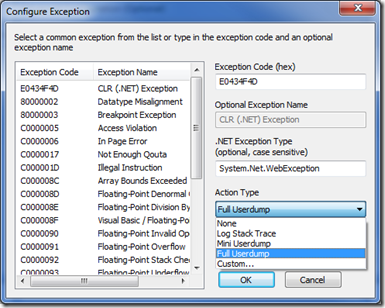
In the ‘Action Type’ pull down specify ‘Full User Dump’ and you will be able to capture the state when we have the 401 (or other) WebException in the w3wp.exe process.
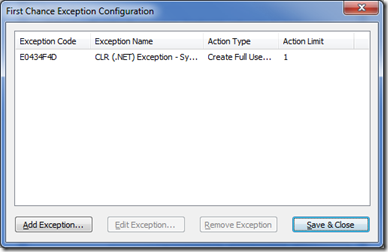
The ‘Action Limit’ by default is set to 1. This means only one dump will be created. If you wish to catch more than one dump, increase this number (usually 3 is sufficient). Then hit OK and proceed by hitting the ‘Save & Close’ button (note you will see the configured CLR exception now).
Finally hit the ‘Next >’ button twice and then ‘Finish’. The rule will be activated.
You do not need to keep the UI up for DebugDiag. If you do keep it up you will see the ‘Userdump Count’ increase with each exception you encounter (up to the limit you set previously) and the location of the dump is listed as well.
Finally to analyze the dump, you can use DebugDiag to analyze the script. You can use the special script I developed here to get a good picture of what the problem may be.
Please drop me a note and let me know if this Post helped you!
