How To: Capture a System.Net trace from PowerShell
Overview
PowerShell can and does use System.Net classes to communicate over the wire. This example will cover capturing a System.Net trace of the Azure PowerShell Publish-AzureWebsiteProject command-let.
Setup
Close any running PowerShell instances. PowerShell reads the .config file when you first start the executable.
Locate the PowerShell (or PowerShell_ise) executable so you can alter the application .config file (or create it).
On my Windows 10 machine the location of the PowerShell executable is here: C:\Windows\System32\WindowsPowerShell\v1.0
Note the ‘CONFIG File’ for PowerShell.exe. If you have file extensions turned on in Windows Explorer it they look like this:
If there are no .config files, don’t panic! You simply will create one.
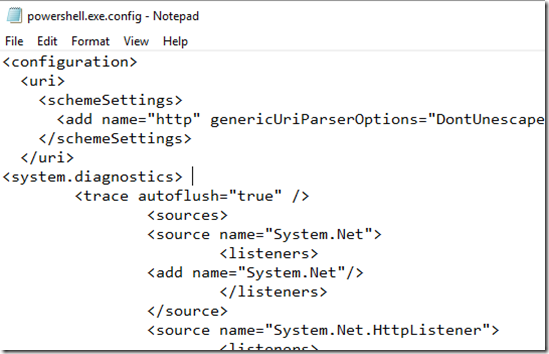
Open (or create) the appropriate .config file. In my case I will not be using the integrated editor so I need to edit powershell.exe.config. This directory is protected however so if you simply open it with notepad and try and save it, you will get this error: You do not have permission to open this file. See the owner of the file or an administrator to obtain permission. ( Note: depending on how your machine is configured, you may have to take ownership of this file – do this in the security tab of the properties).
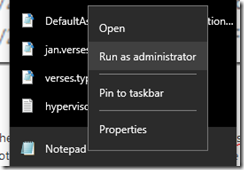
Open notepad (or your favorite editor), right click on the icon and find Notepad.exe, and choose: Run as administrator:
Copy the .config file for a backup and name it something like PowerShell.exe.backupconfig. You can use this to restore the .config file later.
Alter the .config file to enable System.Net tracing. Copy the trace configuration from my blog: https://blogs.msdn.microsoft.com/jpsanders/2009/03/24/my-favorite-system-net-trace-configuration-file-dumps-process-id-and-date-time-information/ and add it to the existing config file or create a new one if it does not exist.
In my case the <configuration> section already exists so I simply need the section and everything inside the <system.diagnostics> </system.diagnostics> section from the above blog:
Find the section: initializeData="System.Net.trace.log" . This section tells where to write the log and the name of the file. We cannot write to this directory so, change that entry to initializeData="c:\temp\System.Net.trace.log"
Save the .config file.
Create the directory c:\temp on your machine and you are all set to trace!
Start powershell and run the command you wish to trace. In my example I navigated to the directory where my WebDeploy package was and typed: Publish-AzureWebsiteProject -Name jspowershellpublish -Package .\PowershellPublish.zip
Exit PowerShell and restore the .config file. If you didn’t have a config file previously simply delete the file you created. If you did have one, copy your backup .config file over top of the one you altered.
Read your trace and enjoy!
Conclusion
This blog is not intended to help you solve you issue but simply give you a tool to collect the System.Net trace. Using System.Net tracing to analyze the network traffic in PowerShell is a powerful tool. I hope this blog helps you grab that trace easily. If you found this blog useful, drop me a note!


