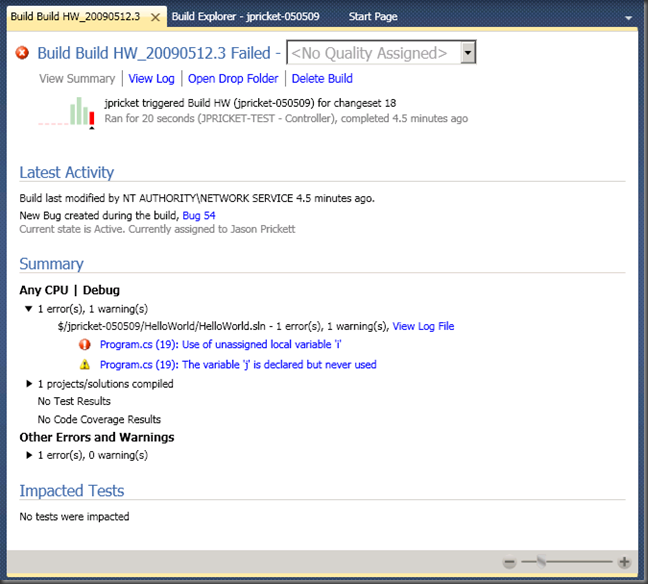
tFS 2010 Beta1 – Build Details View Summary section
The picture above is of the new “Build Report” in TFS 2010. I prefer the term Build Details View, because it is not actually a TFS report object. The view has completely changed, so let me take you on a quick tour:
1. The first thing you may notice is that this is a failed build. The icon in the upper left corner notifies you of the status (in progress, succeeded, partially succeeded, or failed).
2. The next thing on that same line is the build number “Build HW_20090512.3” and the status is repeated as a word. Then comes the Build Quality. That’s right you can change the build quality right here on the build details view.
3. The links on the next line allow you to view the summary page (that’s the page we see above), view the log page (need another post for that one), open the drop folder, and delete the build.
4. The bar graph - now things really start getting interesting. This is a graph of the last 9 builds for the same definition. The small triangle denotes this build. The height of the bars show the relative time that the build took and the color indicates the status. You can also hover over the bar to get a tool tip with that information. This graph is really helpful when the build is in progress, because you can see how long the other builds took and guess how much longer this one will be :)
5. The rest of the information beside the graph includes who started the build (jpricket), what definition was triggered (Build HW), what changeset was built, how long the build took, what build controller was used, and when it was started. A lot of info in a small space!
6. Latest Activity – this section includes who last modified the build and when. It also lists any work items that were opened during the build. Notice the link! Clicking on the link will open the work item :)
7. Summary – This section contains a lot of information. The main purpose is to report the results of the build. It is divided by Configurations with another section at the end for any Errors or Warnings that may have happened outside of a configuration. Each configuration has four sections: errors and warnings, projects/solutions compiled, test results, and code coverage results. Notice the links! You can go to the actual build log for the configuration, or you can click on a particular error and go straight to the source line. (this actually downloads the file and opens the exact version that the Build Machine was attempting to build).
8. Impacted Tests – this section is completely new and allows you to see which tests were impacted by the changes that were checked in.
9. If there were test results, you would also have a link to them, just like you did in TFS 2008.
10. Associated changesets and work items will also show up in their own sections for a successful build. They also have links to open the Changeset details or the Work Item.
11. Oh, and that slider in the bottom right hand corner allows you to zoom in or out.
Hopefully this encourages you to download the Beta and start playing with it!
Comments
Anonymous
May 12, 2009
PingBack from http://microsoft-sharepoint.simplynetdev.com/tfs-2010-beta1-%e2%80%93-build-details-view-summary-section/Anonymous
May 12, 2009
I would love to download TFS 2010 Beta 1 - where can I download it from?Anonymous
May 18, 2009
It just became available for download here: http://msdn.microsoft.com/en-us/subscriptions/downloads/default.aspx?pv=18:370Anonymous
May 18, 2009
The picture above is of the Log View of the new Build Details View in Visual Studio Team System 2010.Anonymous
May 26, 2009
Larry Guger on Work Items Hands-on Lab Ian Hu on Historical Debugging in Visual Studio Team System 2010
