Walkthrough: Using the Tier Interaction Profiler in Visual Studio Team System 2010
In Visual Studio Team System 2010, we've made a huge number of improvements to the Profiler. In case you didn't know that Visual Studio Team System has a Profiler, see the documentation on MSDN. One of the major improvements that we have made to the Profiler is the ability to measure how long the interaction between the application layer and the database layer takes.
Let's say that you have a typical multi-tier application, made up of a presentation layer, an application server and a database at the backend. Let's further assume that you are seeing several reports form customers that some transactions are timing out or are taking too long to complete. How do you go about finding out the root cause of the problem?

Before Visual Studio Team System 2010, you could use the Profiler to diagnose if the failure occurred in either the presentation or middle tier. However, if the performance bottleneck is between the middle tier and the database layer, you are out of luck. In this walkthrough, I'm going to demonstrate how to use the new "Tier Interaction" feature of the Profiler to diagnose failures between the application and data tier.
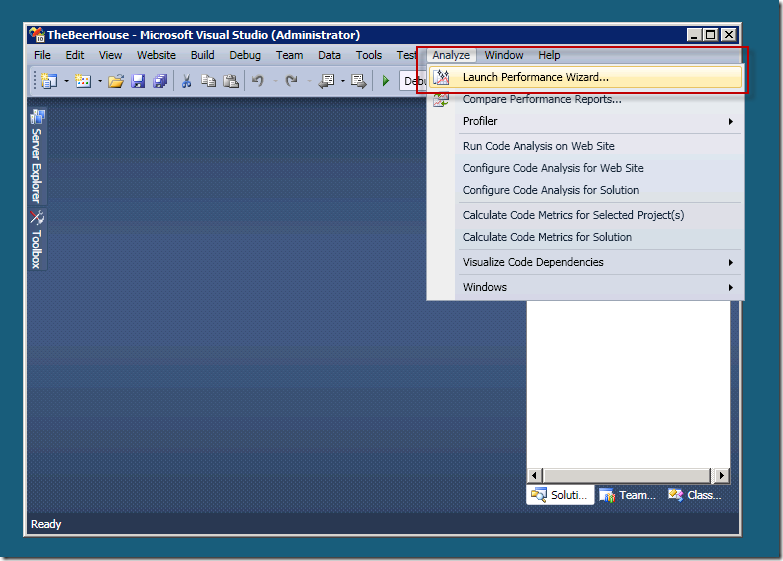
For this demo, I'm going to use the BeerHouse sample application. To start, select the "Launch Performance Wizard..." from the Analyze menu as shown below.
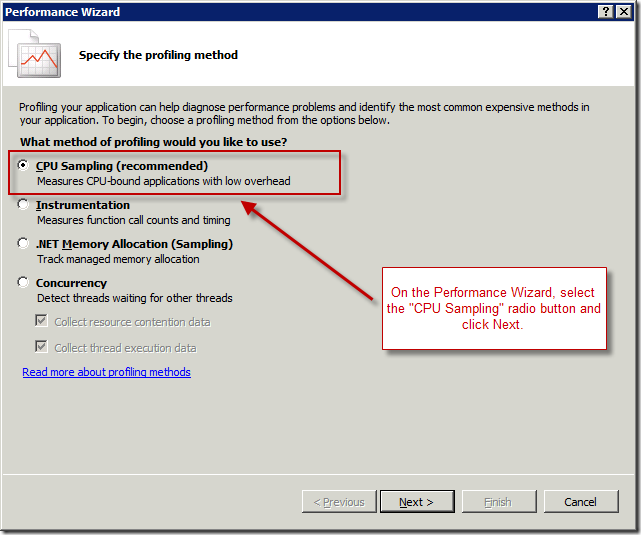
Next, you should see the "Performance Wizard". On this dialog, select the "CPU Sampling" option and click Next.
You should now land on the second page of the Performance Wizard. If the solution that you are planning to profile is already open, the wizard will automatically select it for you. Click the Next button to continue.
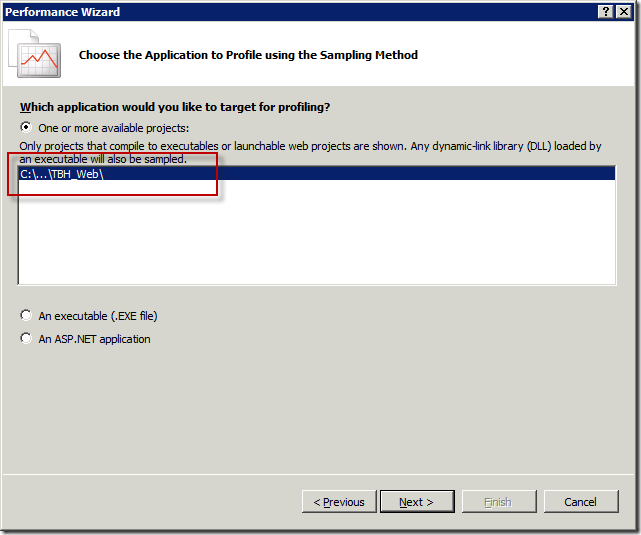
The next step is important! On the last page of the wizard, the checkbox to "Launch profiling after the wizard finishes" is checked. Uncheck it and click the Finish button.
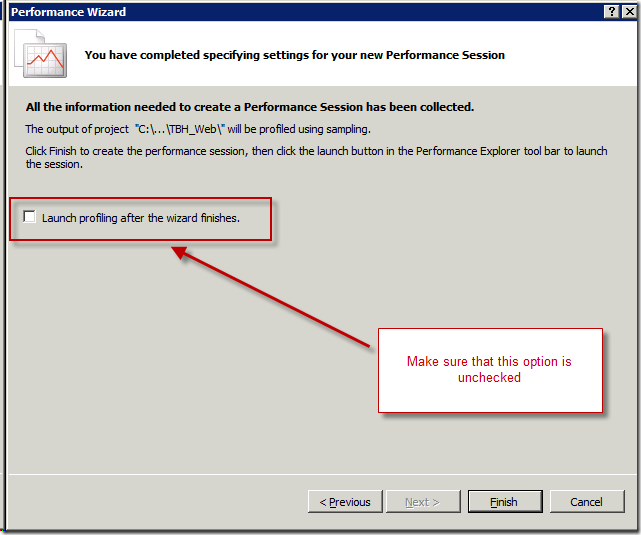
After clicking the Finish button, Visual Studio will open the "Performance Explorer" window and displays the target application to be profiled under the "Targets" node. Right-click the target (in this case TBH_Web) and select Properties, as shown below.
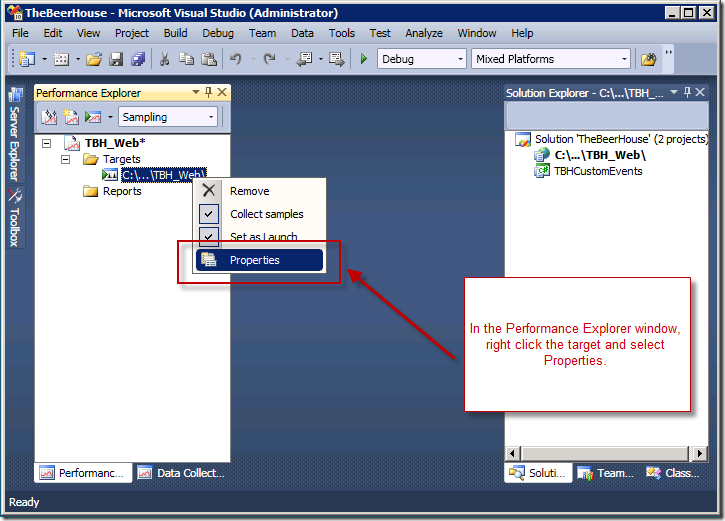
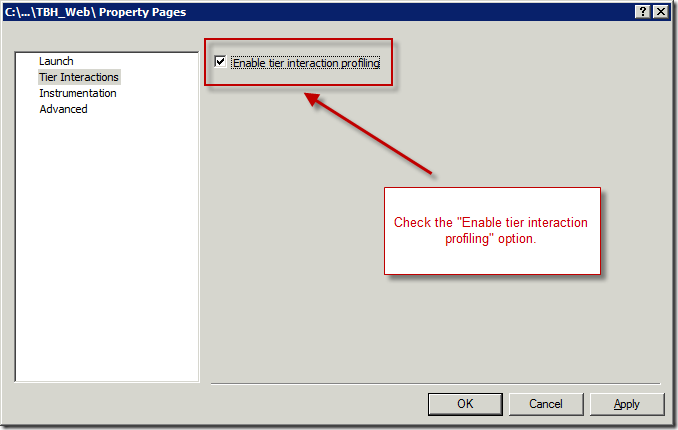
In the Properties dialog, select the "Tier Interactions" tab and check the "Enable tier interaction profiling" checkbox. Press the OK button to dismiss the dialog.
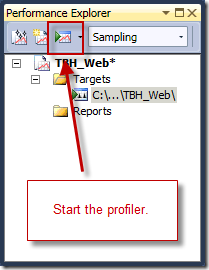
Next, click the "Launch with Profiling" toolbar button in the Performance Explorer window shown below to start the Profiler.
The application will now start. At this point, to reproduce the customer problem, walk through the scenario that the customer or tester reported. While you are going through your scenario, the Profiler is collecting performance data about the application. Once done, close the application. At this point, Visual Studio will display a summary of the performance data that was collected as you were using the application.
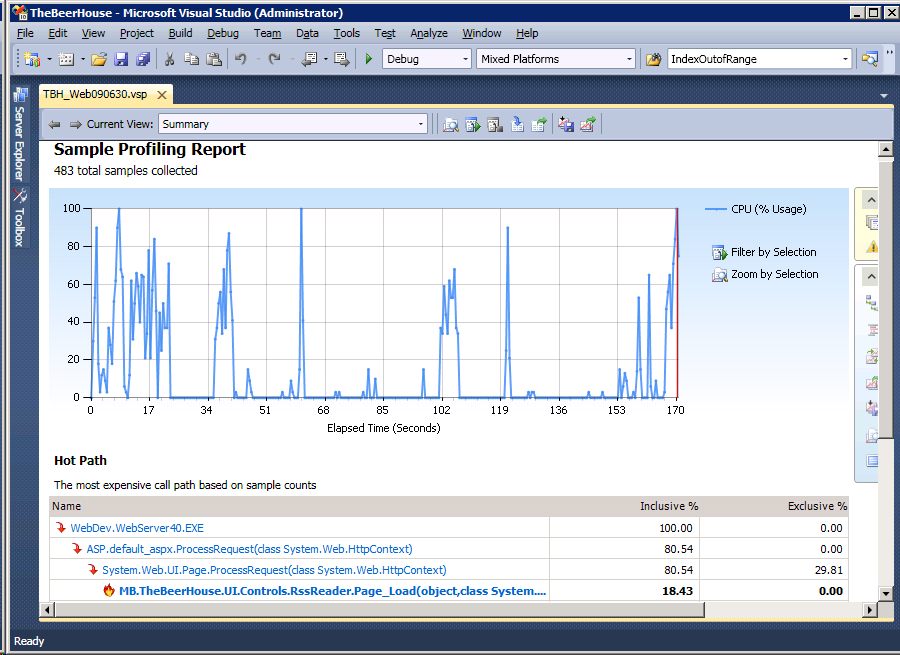
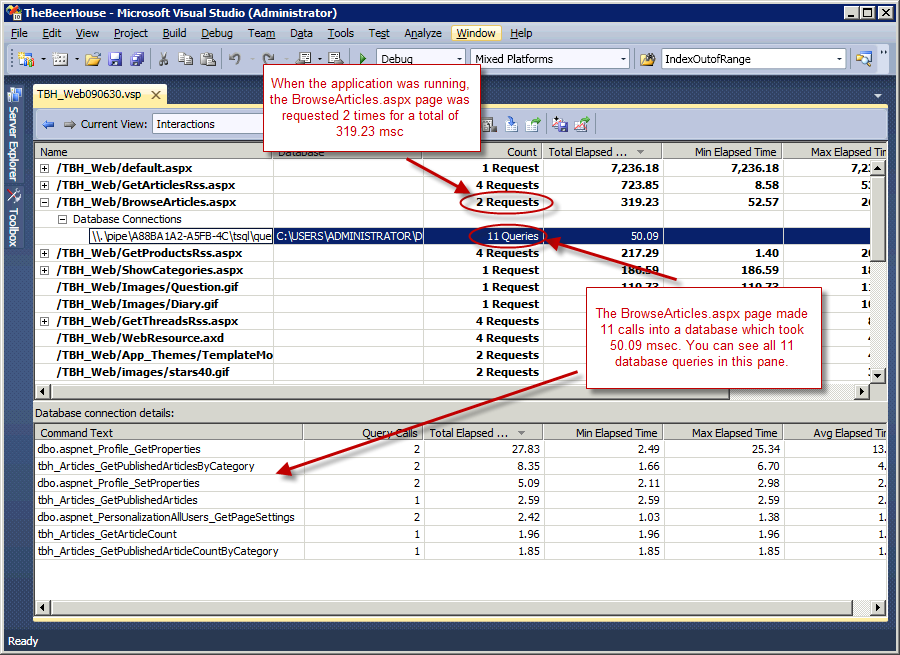
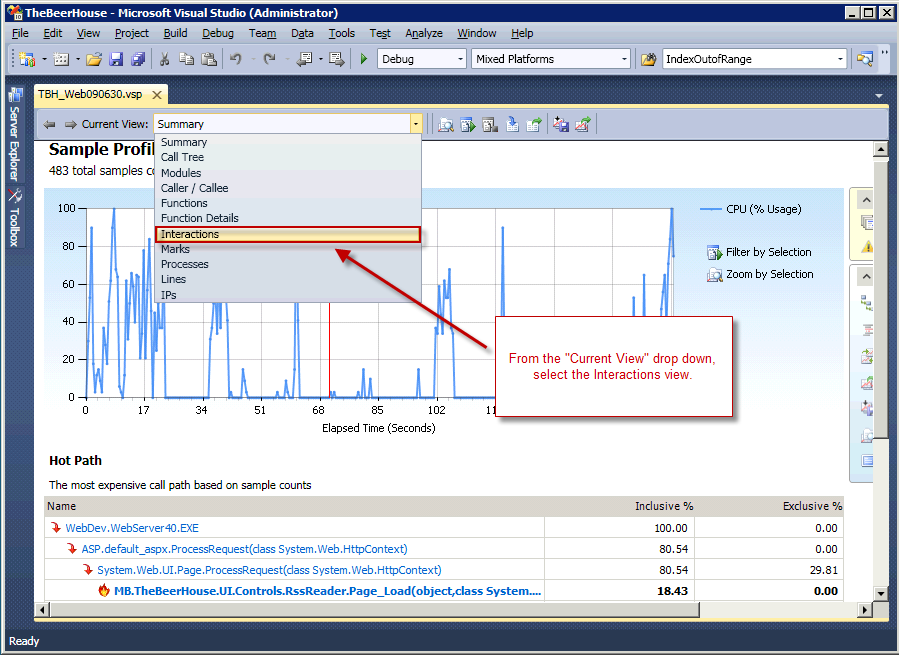
In order to see the interaction between the application and the database, select the "Interactions" view from the "Current View" drop down.
And finally, here is the Tier Interactions view. There is a ton of very useful information on this page, including:
- Which ASP.NET pages were requested, how many times and how long did it take to execute each page
- For each ASP.NET request, which SQL Server stored procedures were called, how many times and how long did the calls take
The Tier Interaction Profiler is available in Visual Studio Team System Beta 1 right now. Feel free to download it and give it a try. If you have any feedback, send it my way.
Habib Heydarian.
