An in depth look at the Historical Debugger in Visual Studio 2010 (Part IV)
In this segment on the Historical Debugger, I’m going to focus on how the Historical Debugger can help in debugging Build Acceptance Test failures or what is commonly referred to as Build Verification Tests (BVTs). Imagine this scenarios: As part of your nightly build, you run a bunch of tests to verify quality of the build. One or more these tests fail. You and your team now have to go through a fire drill to try and figure out which tests failed and why. A lot of times, you may not be able to run the failing test on your machine to debug the failure because of environment issues, different configuration, etc. What you really want is a way to debug the problem without having to reproduce the problem. With the Historical Debugger, since it lets you record the application execution history, you can simply replay the log file in Visual Studio when the test fails. Let’s look at an example.
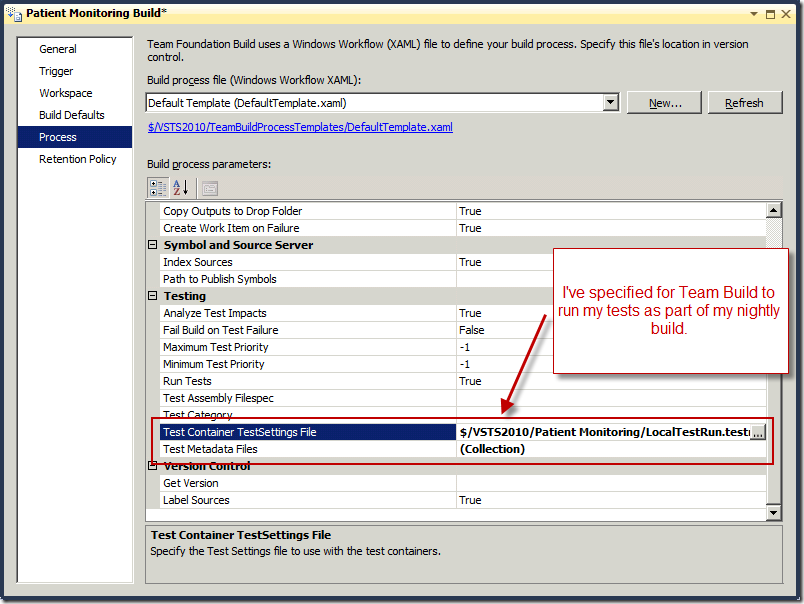
In the Patient Monitoring application, I have a number of tests that are part of my Team Build and these tests run every time I kick off a new build. As shown the in the screen shot below, I’ve specified for Team Build to run my tests as part of the nightly build.

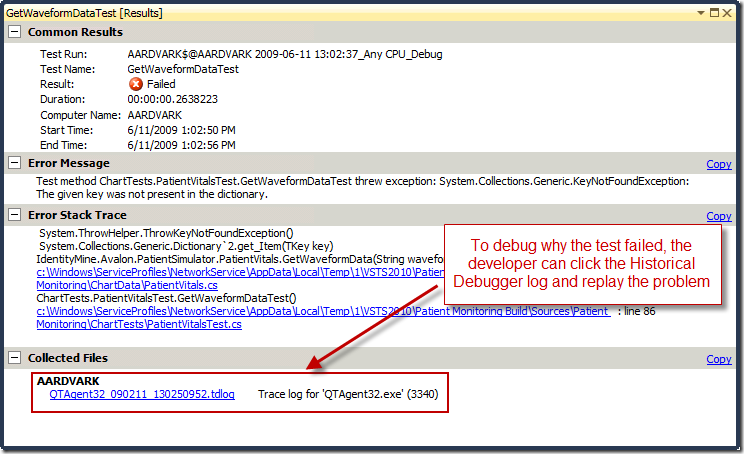
When I now kick off a build, it will also run my tests. While this feature exists in previous versions of Team System, what’s new with the Historical Debugger is that if a test fails, the Build Summary page will display a link to the Historical Debugger log that contains a recording of the failure. As a developer, I can click the link at which point it will open in Visual Studio and I can start replaying the problem. As can be seen in the following screen shot, to debug why a test failed, the developer can click the Historical Debugger log and replay the problem.

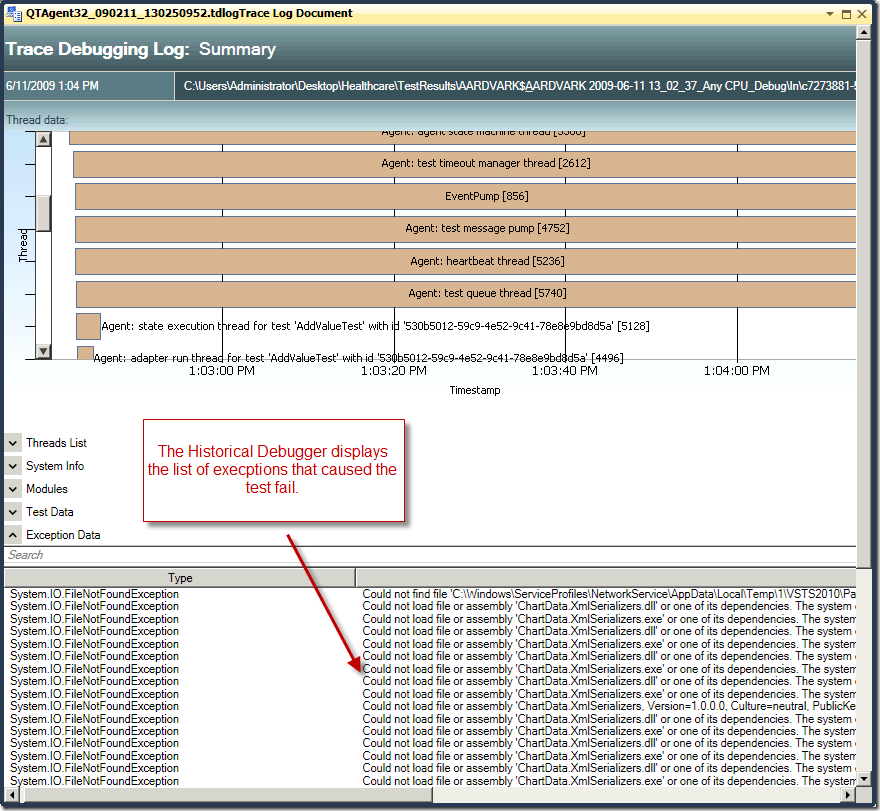
When the developer clicks the log file, the Historical Debugger summary page opens which shows a summary of the recording. From here, the developer can start debugging the problem by double-clicking any of the exceptions in the Exceptions list.

Habib Heydarian.
Comments
- Anonymous
June 12, 2009
PingBack from http://www.alvinashcraft.com/2009/06/12/dew-drop-june-12-2009/