An in depth look at the Historical Debugger in Visual Studio 2010 (Part III)
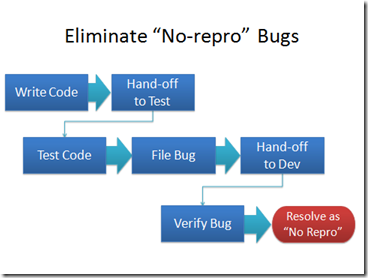
In part III of the coverage of the Historical Debugger, I’m going to look at another scenario of the Historical Debugger which is the ability to record and playback manual test failures. One of the problems areas in software development that really impacts productivity is non-reproducible bugs which are code defects that only occur in production or in testing environments but cannot be reproduced on a developer's machine. One example of this type of defect is when a tester finds a bug during testing but the developer can't reproduce it on his machine which invariably results in the following outburst by the developer: "It works on my machine!"
The diagram below depicts the typical workflow between a developer and a tester which results in frustration on both the developer's and testers side, not to mention wasted time.

One the key scenarios that the Historical Debugger enables is that it tries to eliminate the issue above by recording the test failure and then allowing the developer to replay a recording of failure. Think of this as a flight recorder for an aircraft. If the aircraft experiences difficulties, the investigation crew can recover the black box and replay the events that led to the problem.
Let’s walk through an example, using the ExpenseIt WPF application.
Tester executes manual test and creates bug
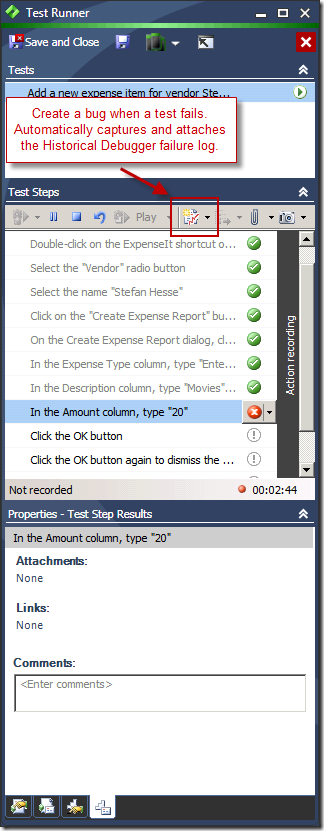
Using the new Microsoft Test and Lab Management application, the tester can create and run any number of manual tests. When a test fails, the tester can create a bug directly from within the Test and Lab Management UI using the Test Runner window. In addition, while the test is running, the Historical Debugger runs in the background and records the execution of the application (not the test itself), so that once the developer gets the bug, he can debug the failure log in Visual Studio.

Developer debugs manual test failure
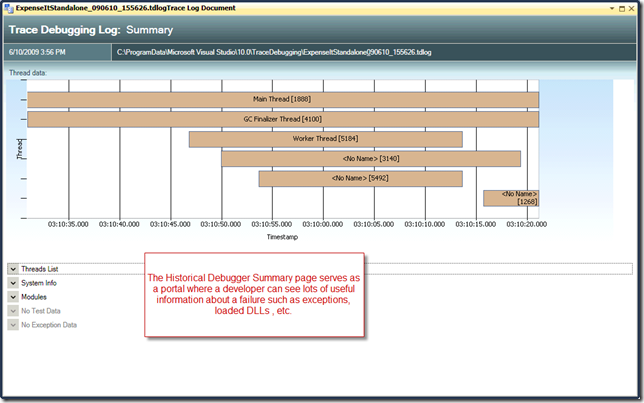
Now when the developer receives the bug from the tester, he has all he needs to diagnose the problem. One of the attachments that is included with the bug is the Historical Debugger log file which contains a complete history of the applications' execution. Double-clicking the Historical Debugger log file opens it in Visual Studio and and displays the Summary Page (see screen shot below). From here, the developer can see which threads where running, the System Information about the applications' environment, e.g. OS type, screen resolution, etc. If there were any exceptions in the application, the developer can also see those. The developer can now jump off straight into his code by double-clicking any of the items on the summary page and navigating through the code. Once in the debugger, the experience is exactly the same as Part I & Part II.

Habib Heydarian.
Comments
Anonymous
June 11, 2009
PingBack from http://www.alvinashcraft.com/2009/06/11/dew-drop-june-11-2009/Anonymous
June 16, 2009
Visual Studio 2010's Historical Debugging feature fascinates me. As you sit in the debugger, being able