Using RSCA to help you understand what your IIS server requests are doing
RSCA – an acronym for Runtime Service and Control API is a little know and little talked about feature of the IIS server starting with now obsolete version 7.0 (which came with Windows 2008 Server). This feature can provide real time snapshots of what is going on inside the IIS worker process without impacting performance or the need for outside tools. RSCA is actually a component that is built into the IIS server and can be used easily from the IIS Manager console.
In this article, I want to demonstrate how to setup and how to make use of this IIS component.
Installing RSCA:
Even though it is part of the IIS server, RSCA is seldom installed by default. Starting with IIS 7.0, the IIS web-server architecture is modular, and by default, when you install IIS you only get a subset of the modules that allow the server to serve static content – such as HTML pages, images and JavaScript files. Other components, such as those that allow you to execute ASP.net sites are optional and can be installed from the Server Manager.
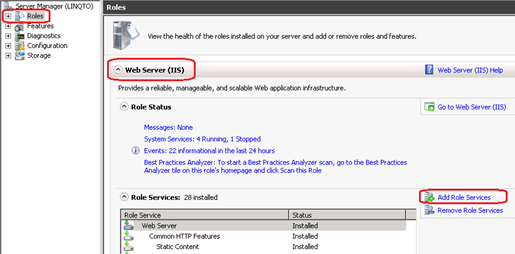
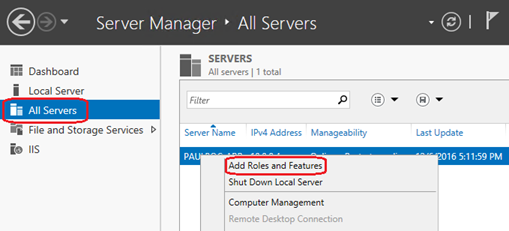
To install RSCA, or check that you have RSCA installed, head to the Server Manager, and check the server 'Roles' part – if you are running Windows 2008 R2 Server, or go to the Server Manager and check the 'All Servers' item in the Server Manager, chose the server you are on from the list of servers, and then right click it and select 'Add Roles and Features' from the context menu. Then select the Web-Server role from the Wizard.
 |
 |
Server Manager on Windows 2008 R2 SP 1 |
Server Manager on Windows 2012 R2 |
In both cases – Windows 2008 R2 server and Windows 2012 R2 server, you will now be presented with the list of features that is available for the IIS web-server role. Underneath the 'Health and Diagnostics' feature, you will need to make sure that the 'Request Monitor' checkbox is checked for RSCA to be installed.
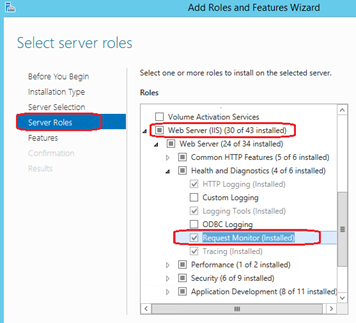
Add Roles and Features Wizard.
If you have to install RSCA, just know that there will not be any interruption to the services, web-applications or web-sites that you are running on the IIS server. They will continue to run and RSCA will be available on all of them following the install. You will only need to close and restart any IIS consoles that you have open.
Using RSCA:
RSCA runs on a client server architecture principle. There is a component from the Runtime Service and Control APIs that will be loaded inside the Windows Process Activation service. This acts as a server for both the IIS console, which loads a RSCA client component, as well as the IIS worker processes which also load a component allowing runtime information to be queried via RSCA. The architecture diagram with the interactions of the components looks like the below:
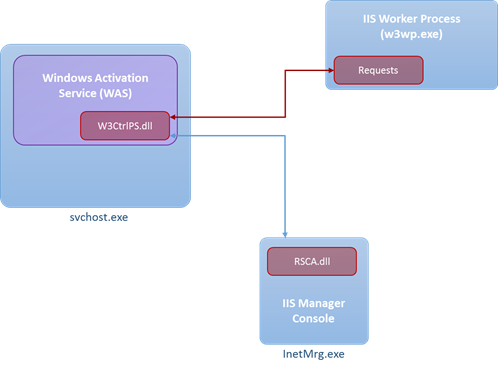
RSCA Architecture Diagram
Now let's start using the RSCA functionality to get data from the server. The first thing we have access to is the list of worker processes (w3wp.exe) that are running and which application pool they are associated with. If you click on the server node in the IIS manager console tree view control, you will be shown a 'Worker Processes' icon in the center pane:

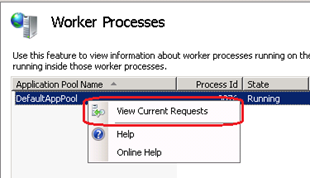
Once you have located a worker process that is service the application pool you are interested in, you can right click this worker process and select 'View Current Requests' from the context menu. This is like taking a snapshot of activity in the process. It will show you all executing requests that have been inside the w3wp.exe for more than 0 seconds.
If you have requests which are slow or you think are stuck, you can check if these requests have actually made it into the IIS worker process. The below screenshot shows some requests which have longer execution times and are slow to respond. This can be for a couple of reasons, but you can also clearly see the pipeline stage the request is in, as well as the request URL, the IP address of the client, and how many seconds the request has been inside the worker process for at the time when the snapshot was taken.

You may find out more about pipeline stages by watching this video (https://linqto.me/IISArchP2) in the IIS architecture and components series I have published online some time ago, and which can be found here: https://linqto.me/n/IISArchitecture.
In the snapshot above, all requests are in the ExecuteRequestHandler stage inside the ISAPI module -this is because my application pool was running in classic mode and not in integrated pipeline mode. If you hit the refresh key on your keyboard (F5) while in this view, it will cause RSCA to generate a new snapshot, to see if the requests are still in the same state as before. If a request is still present, you will note that the 'Time Elapsed' column value for the specific request will have increased.
This is an easy way to see if you have some requests which are getting queued or are slow while executing inside the IIS worker process. You can then use tools like Debug Diag 2.2 (https://linqto.me/DebugDiag ) to gather memory dumps of the process for further investigations.
By Paul Cociuba
https://linqto.me/about/pcociuba