Fast Prototyping with PowerPivot
Today's "better together" post is by Poornima Hanumara, a program manager on the Office BI team. Thank you Poornima, and to our readers, have a great week!
I want to quickly prototype a new dashboard to keep track of the products in my sporting goods store.
PowerPivot is a great tool to create a data model. This model can be used as a data source for PerformancePoint Services to create a dashboard.
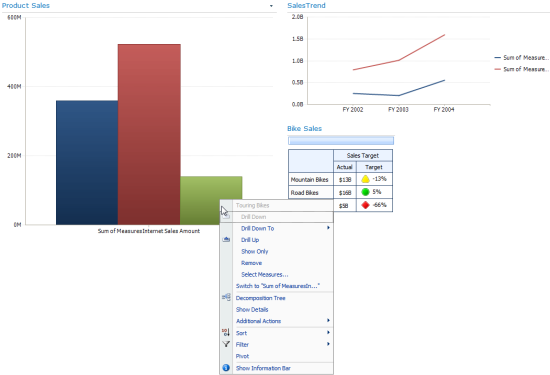
Here's the simple dashboard I want to create:
To get started I need:
- PowerPivot add-in for Excel 2010
- Sharepoint Server 2010 with PowerPivot installed and enabled
- PerformancePoint Services for SharePoint 2010
It was a quick 3 step process to create the dashboard:
Step 1: Create a PowerPivot model
I used Excel, which had my sample data to create a PowerPivot model using some help from the PowerPivot TechNet Virtual Lab.
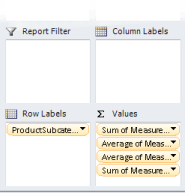
I created a PivotTable in Excel using the model and put all the measures in the Values field. Without doing this, PerformancePoint will not be able to distinguish measures from dimensions. So, make sure all the fields you want to use as measures are in the Values field in the PivotTable Field List!
Step 2: Publish the workbook to Sharepoint
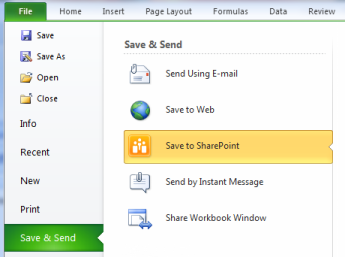
I saved the workbook to the Sharepoint Server which had PowerPivot for Sharepoint enabled:
Step 3: Use the workbook's URL in the data source connection string in Dashboard Designer
I set the connection string to the PowerPivot datasource by using the following format:
PROVIDER=MSOLAP;DATASOURCE=https://contoso/Documents/PowerPivot_Sample.xlsx
Create a PowerPivot Data Connection has step-by-step instructions on how to create a new datasource.
In the familiar PerformancePoint Dashboard Designer, I created the dashboard and deployed it to Sharepoint. The final dashboard looks pretty similar to the initial sketch!


