An AX environmental process map in detail
I recently reviewed the new training material for the AX2012 version of the Environmental dashboard (EMS). A little late in the process I realized that the details on the Environmental process map were a bit insufficient for this feature. I wanted to remedy this since it is really a very “presentable” part of the environmental dashboard feature set.
When we created the environmental dashboard, we knew that it was going to be hard to identify all the flows of substances that a typical company may wish to track. So we scoped the process map at a relatively early stage in the process and we even managed to send out a few pictures showing early prototypes of the process. map. In the end, the process map did not make it into the AX2009 release, but it became a part of AX2012.
You can create a new version of the process map from Compliance and internal controls > Common > Environmental sustainability > Environmental processes > Environmental
process map:
The Process map has four different types:
- Model
- Substance flow
- Budget
- Budget comparison
Each type illustrates key points in the Environmental module. The Model is the essential part when working with EMS and you must define very precisely what (Substance or Substance groups) goes from where to where (Processes).
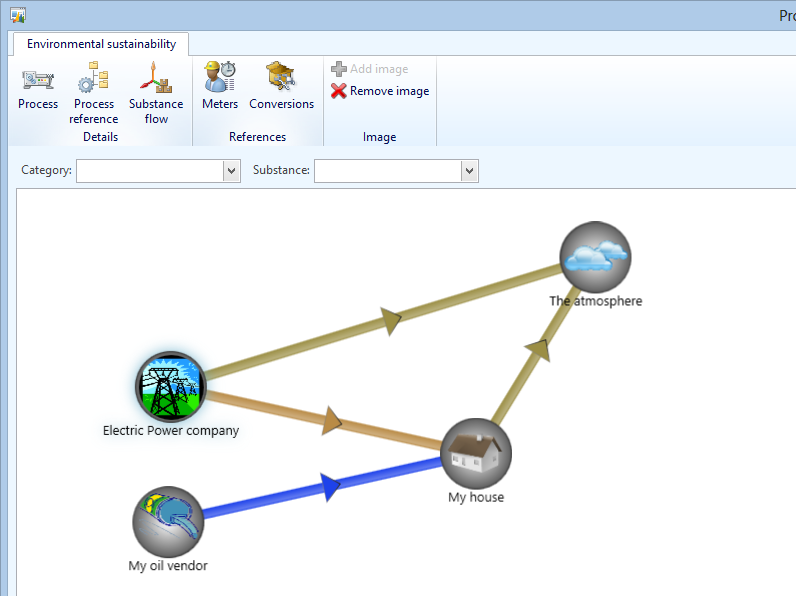
An example of a simple model is a normal house that uses electricity (bought from an electric power company) and is heated by a furnace using fossil oil. This model would look like this in the Process map:
I have modeled electricity from the Power plant, Oil from the Oil vendor and CO2 from both my house and the Power plant. Yes, I know the Oil vendor pollutes as well – this is just an illustration of the environmental process map. I am showing a limited set of processes by using the query functionality of the process map.
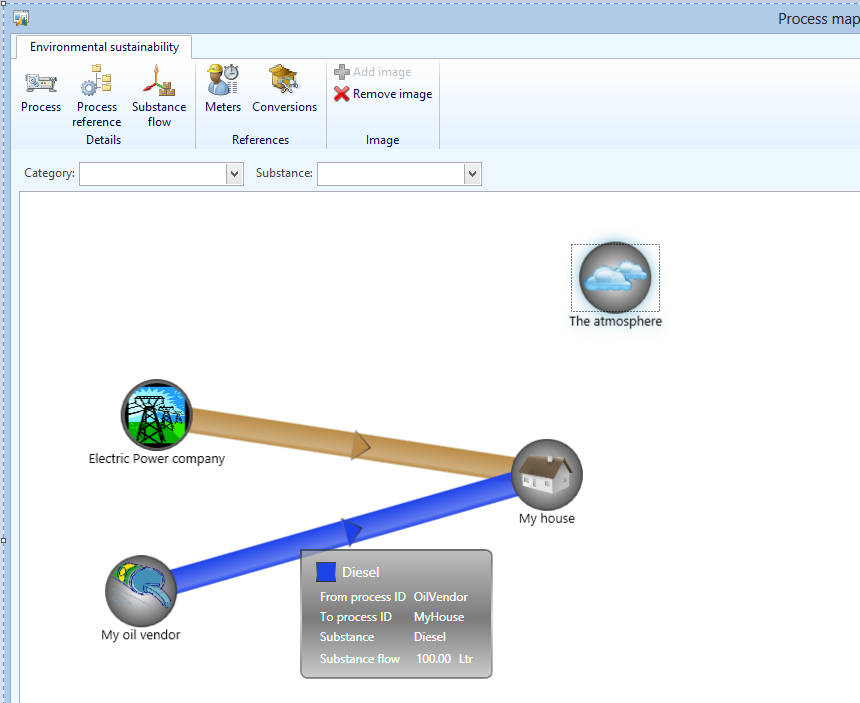
The second type is a substance flow. I go ahead and buy/register both some electricity and some Diesel and create a new process map with the same processes as in the previous illustration:
I hover over one of the substance flows so that I can see that I bought 100 liters of Diesel. There are no CO2 emissions yet because I haven’t set up environmental calculations to calculate how much CO2 I would emit with my energy purchases.
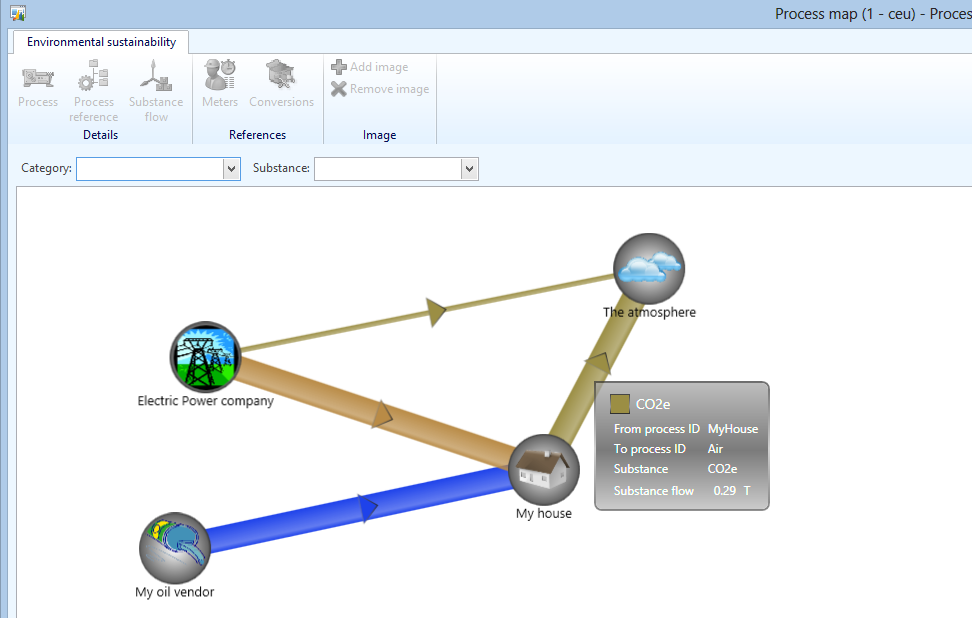
After setting up environmental conversions and running the “Calculate conversions” job, I can see the extent of my CO2 emissions. It seems that I have just emitted .29 T of CO2 and relatively less indirect emissions based on my electricity purchases. Notice that the two lines of CO2e (carbon dioxide equivalent) have different widths. The width of an arrow is relative to other lines of the same substance. The line with most quantity is equal to 100% or “normal” width and lines with smaller quantities of the same substance has a
smaller width relative to the 100% width quantity line.
The third type of process map is the budget. The budget represents the amount that the company plans to emit during a given period and it is defined on the process reference.
Notice that the width of the CO2e lines are relative to each other. In this case, I have defined the budget of indirect CO2e emission from the utility to the atmosphere to 20 T while the direct emission is only 10 T. This will limit the line between my house and the atmosphere to half the width of the line between the power company and the atmosphere.
Finally, the last type of the environmental process map is the budget comparison type. The budget comparison compares the budget with the actual values based on what was selected in the query form of the process map. This includes the date interval of both budget lines and the actual data lines.
In the following screenshot I have created budgets on my entire model which is likely not a typical scenario and the results are also a little unusual. We seem to have purchased too much electricity (red line) but our indirect CO2e emissions from the power company are still very much within budget (thin green line).
The width of a green line represents the relative difference between actual emissions and the budget. In the screenshot my purchases of diesel are currently at 50 percent of my budget:
I hope this quick introduction was helpful and I wish you the best of luck defining your model, conversions and budgets for a, hopefully, reduced emission of harmful substances.


