Profiling Entity Framework using the Visual Studio 2010 Profiler
A previous post discussed potential issues with Compiled Query recompiles. The cause of the recompile issues were actually uncovered by using the Visual Studio 2010 Profiler. This blog will cover how the Profiler can be used to discover performance issues in the Entity Framework. The sample code from the previous blog will be used as the code to be profiled.
Basically the code executes a compiled query against the Northwind database via the Entity Framework. The LINQ query (using LINQ to Entity) returns all Customers whose CustomerID starts with “C”. The code first executes the query using a .Any() operator to see if there will be any records returned and if so executes the query and returns a list of records which we then take the count of to make sure all of the records are inspected. The queries are executed 100 times. The sample is in a solution named EFTest which you can download here.
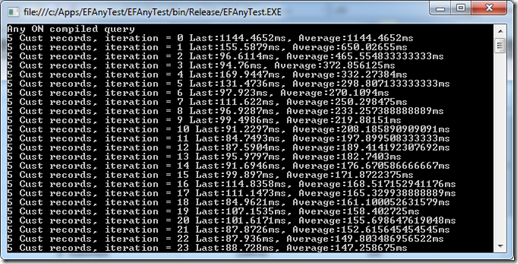
Executing this class returns the following results:
Notice the first query took 1144ms which is significantly longer than the follow on queries. This is due to the warm-up that happens in the Entity Framework when an application starts. The first time an ObjectContext is used, EF opens up a connection to SQL Server and loads up the metadata for the EF model. This metadata includes the mappings between the physical and conceptual models and any pre-compiled view SQL.
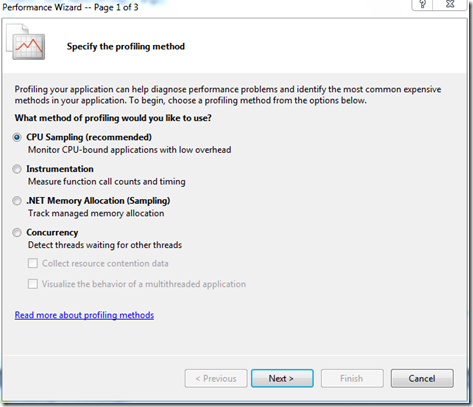
Now let’s dig into the performance of the LINQ queries. The Visual Studio Profiler can be used to isolate potential performance issues. The Profiler can be enabled by selecting “Analyze | Launch Performance Wizard…” from the Visual Studio main menu. This launches the Performance Wizard which is shown below:
Take the default and hit “Next”, take the default for the target application, press “Next” and then uncheck the option “Launch profiling after the wizard finishes”. Now press “Finish” which will close the wizard.
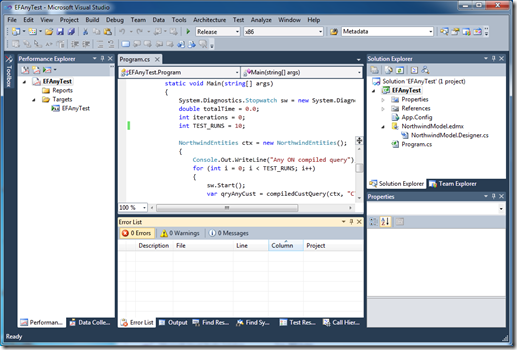
The Performance Explorer should be shown in Visual Studio:
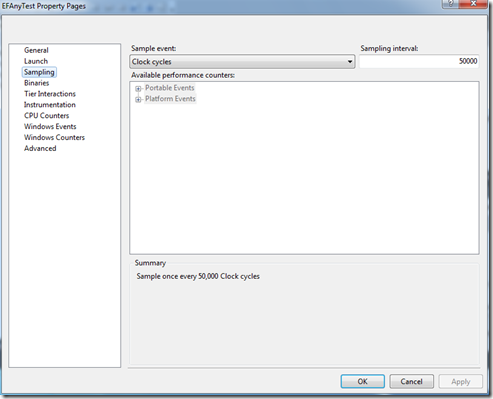
Right click on the EFTestAny project in the Performance Explorer and select “Properties”. Select “Sampling” from the properties list and change the Sampling interval to “50000”. This will make the profile take executions samples at a faster rate which increases accuracy when profiling such a small amount of code. Click “Ok” to close the property page.
Before we start the profiling, one more task needs to be completed. Remember the first query took significantly longer than any of the subsequent queries due to opening the connection to SQL Server and EF metadata loading? We need to factor the warm-up out of the performance measurements. This can be done by making marks in the data collected by the profiler and then filtering the results on those marks. The Profiler’s API can be used to insert Data marks via code.
To use the Profiler API, a Profiler assembly needs to be added as a reference to the project. Right click on “References” in the Solution Explorer and pick “Add Reference…”. Use the Browse tab and select c:\Program Files\Microsoft Visual Studio 10.0\Team Tools\Performance Tools\Microsoft.VisualStudio.Profiler.dll
Next the DataCollection.CommentMarkProfile() method can be used from the code. This method adds a numeric mark and comment into the performance data being collected by the profiler. The method is passed a MarkId which is an integer and helps in ordering the marks and a description string. The CommentMarkProfile() call needs to happen after the first round of queries to get past the warm-up so that the cost can be excluded from the analysis. To do that, the following code is added after the results are printed for each pass (note the if statement makes sure the mark only happens after the first iteration):
 if (i == 0) //Mark profile data after first pass as it is warmup
{
    //Mark profiling data
    DataCollection.CommentMarkProfile(100, "After Warmup - Any ON compiled query");
}
Finally, the CommentMarkProfile() operation is called after the for loop completes before the code pauses for a key press. The code for the second mark is shown below:
 DataCollection.CommentMarkProfile(110, "Queries Done");

The complete code with the calls to the profiler API is shown below:
    1: using System;
    2: using System.Collections.Generic;
    3: using System.Linq;
    4: using System.Text;
    5: using System.Data.Objects;
    6: using System.Data.Common;
    7: using System.Data.EntityClient;
    8: using System.Data;
    9: using Microsoft.VisualStudio.Profiler;
   10:
   11: namespace EFAnyTest
   12: {
   13:     class Program
   14:     {
   15:
   16:         static Func<NorthwindEntities, string, IQueryable<Customer>> compiledCustQuery =
   17:            CompiledQuery.Compile((NorthwindEntities ctx, string start) =>
   18:            (from c in ctx.Customers
   19:             where c.CustomerID.StartsWith(start)
   20:             select c));
   21:
   22:         static void Main(string[] args)
   23:         {
   24:             System.Diagnostics.Stopwatch sw = new System.Diagnostics.Stopwatch();
   25:             double totalTime = 0.0;
   26:             int iterations = 0;
   27:             int TEST_RUNS = 100;
   28:
   29:             NorthwindEntities ctx = new NorthwindEntities();
   30:             {
   31:                 Console.Out.WriteLine("Any ON compiled query");
   32:                 for (int i = 0; i < TEST_RUNS; i++)
   33:                 {
   34:                     sw.Start();
   35:                     var qryAnyCust = compiledCustQuery(ctx, "C");
   36:
   37:                     if (qryAnyCust.Any())
   38:                     {
   39:                         var qryCust = compiledCustQuery(ctx, "C");
   40:                         Console.Out.Write("{0} Cust records, ",qryCust.ToList().Count());
   41:                     }
   42:                     sw.Stop();
   43:                     totalTime += sw.Elapsed.TotalMilliseconds;
   44:                     iterations++;
   45:                     Console.Out.WriteLine("iteration = {0} Last:{1}ms, Average:{2}ms", i, sw.Elapsed.TotalMilliseconds, (totalTime / (double)iterations));
   46:                     if (i == 0) //Mark profile data after first pass as it is warmup
   47:                     {
   48:                         //Mark profiling data
   49:                         DataCollection.CommentMarkProfile(100, "After Warmup - Any ON compiled query");
   50:                     }
   51:                     sw.Reset();
   52:                 }
   53:                 Console.Out.WriteLine("");
   54:             }
   55:             DataCollection.CommentMarkProfile(110, "Queries Done");
   56:             Console.WriteLine("Press and key to continue....");
   57:             Console.Read();
   58:         }
   59:     }
   60: }
Now it’s time to profile the application. In the Performance Explorer, click on the icon for “Launch with Profiling”.
Note: If you see an error message about not being able to open the profiler driver, select “Yes” to upgrade the credential of the current user.
The application will execute and then press the <Enter> key to close the application. Visual Studio will churn for a few minutes and then show the Profile report, but were not ready to study it just yet. These results still contain the warm-up code profile data which includes the loading of the metadata and connecting to the SQL server. To look only at the LINQ query execution, change the “Current View” of the report to “Marks” via the drop down list. A list of profile data marks will be shown including the ones that were set in the code. Highlight all of the marks between the two custom code marks (100 and 110), right-click and select “Add Filter on Marks”:
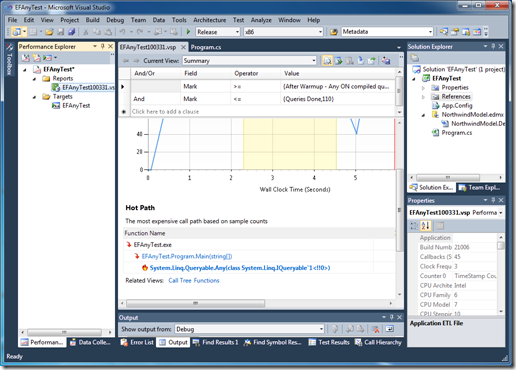
Now press the “Execute Filter” button which is the second one to the right of the Current View dropdown list. This will filter the profile data and only include data between the marks we inserted via code and then it will change the current view back to the Summary view. Scrolling down on the refreshed report shows the code HotPath(the section of the code that took the majority of the time executing):
As shown above, the call to System.Linq.Queryable.Any() is shown as the most expensive call. This call should be fast because it should simply check if any records are return in the result set so we need to drill in further to find the root cause.
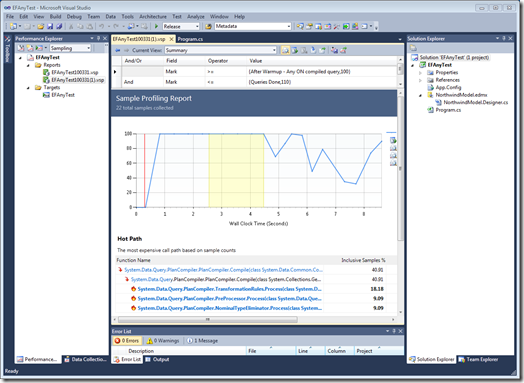
To do this an additional option needs to be changed. Select “Debug | Options and Settings…” from the Visual Studio main menu. Click on “Performance Tools” and uncheck the “Enable Just My Code for profiler reports (sampling)” in the “Just My Code” section and press the “Ok” button. Now re-run the profiler to generate a second report and then filter that report on our code marks as we did above.
Now the report shows a lot more detail. The System.Data.Query.PlanCompiler class is being called even though the query should have already been compiled the first time we accessed it during our warm-up pass. As discussed in the previous blog entry, the call to the Any() method on the IQueriable is causing the query to re-compile each time which is an expensive operation.
CONCLUSION
As you can see, the Visual Studio 2010 Profiler can be a powerful tool to track down potential bottlenecks in your Entity Framework code or other parts of your application. And using the Profiler APIs, provides an easy way to hone in on performance characteristics of specific parts of an application. So go forth and profile that code, you never know what you will uncover.
Author: Dana Kaufman
Reviewers: Daniel Simmons, Jaime Alva Bravo, Paolo Salvatori
