Debugging startup crash of a universal app
You'll need a few tools:
- NP Profiler
- Make sure to select the Store App version of NP
- https://www.microsoft.com/en-us/download/details.aspx?id=35370
- WinDbg
- If you have the Windows Developer Kit, you already have it
- https://msdn.microsoft.com/en-us/windows/hardware/hh852365
- SOSEX
- This is an extension to analyze managed stacks in WinDbg
- https://www.stevestechspot.com/
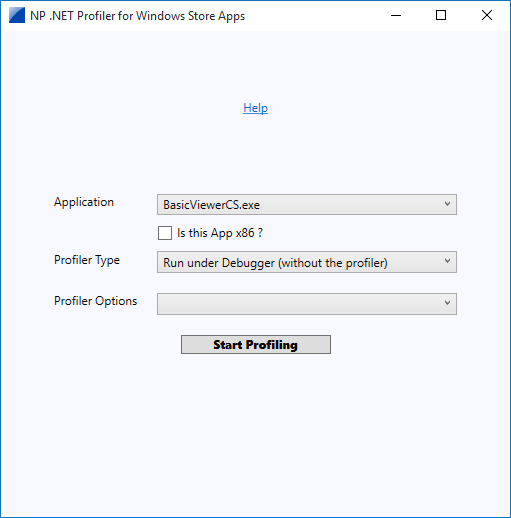
Start the NP profiler and select your app. Select "Run under Debugger (without the profiler)" and select WinDbg from the Profiler Options.
Click on Start Profiling. WinDbg will start up and immediately kick off execution of your application.
Immediately, load SOSEX by executing:
.load [path\to\sosex\sosex]
Set WinDbg to break on CLR exceptions by executing:
sxe clr
Continue execution of your app under WinDbg until you hit the first chance exception. Once there, you can list the stack trace by executing:
kP
Or list the managed stack trace (with access to IL) by executing:
!mk
This should tell you where your application is crashing. The first chance exception will typically give you an address in memory of the instruction that failed, and if it's in managed code, it'll tell you the IL+number where it happened. That number is the number of IL instructions into the method where it failed. You can list the IL for the method by clicking on the IP of the function, or typing !muf [memory address]
So for example, if the exception tells you that it's thrown from IL+001e you can go to the method that threw and see what is in that space:
In this example, the exception was thrown when we called Window.get_Content.
Comments
- Anonymous
October 11, 2015
The comment has been removed


