Variables, Literals, Procs and Stats
This post by US PFE Susan Van Eyck goes through considerations when developing stored procedures using local variables and literals, and their effect on the query plan / performance.
I ran across a very interesting blog post by Kendra Little this week about the perils of troubleshooting – or developing – stored procedure using local variables.
I’ve often done this myself. You morph the CREATE statement into a DECLARE, plug in some values, then try to figure out why the query is misbehaving.
[sql]--CREATE PROC dbo.DoSomethingUseful
DECLARE @parm1 INT = 875,
@parm2 VARCHAR(10) = 'ABC'
AS
BEGIN
-- Useful bits here
END
GO[/sql]
The problem here is that those local variables behave differently than either stored procedure parameters or literal values and you can end up with bad/wrong/misleading query plans because of it.
To demonstrate, consider these two very similar queries. Both will return 4 rows.
[sql]SELECT City FROM Person.Address WHERE StateProvinceID = 80;
DECLARE @StateProvinceID INT = 80;
SELECT City FROM Person.Address WHERE StateProvinceID = @StateProvinceID;[/sql]
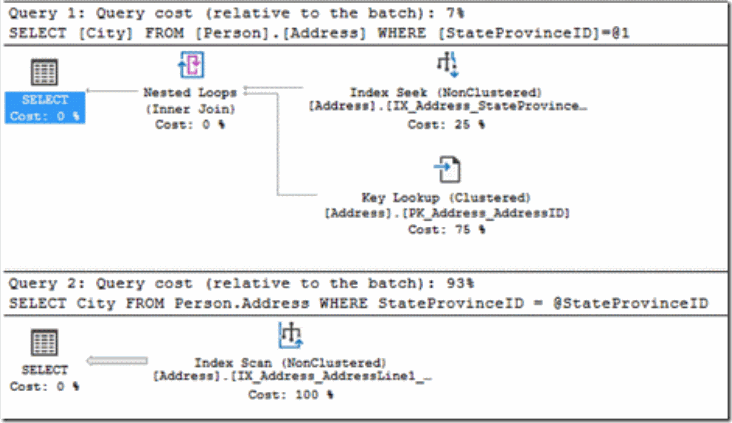
Executing them with the options to Include Actual Query Plan and SET STATISTICS IO ON you find that the first one (using the literal value) has a very efficient query plan (Index Seek + Lookups) requiring only 10 logical reads, but the second (using the variable) is executed using an Index Scan at a cost of 216 logical reads. [Interestingly we’re scanning a nonclustered index because it happens to covers the query and saves us the higher cost (346 logical reads) of a clustered index scan.] 
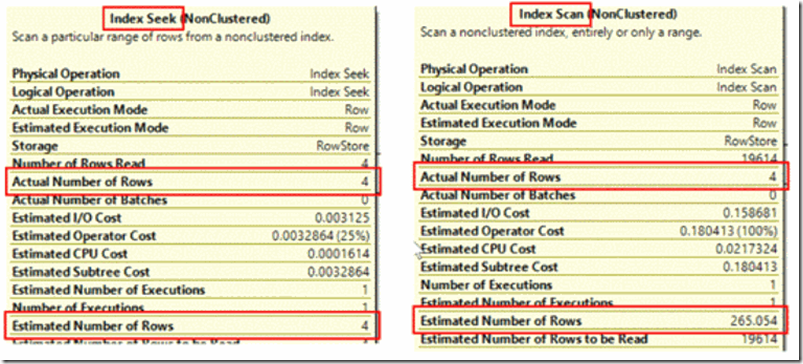
The first query is auto-parameterized (note the =@1 in the plan’s SQL text), but that doesn’t account for the difference. Adding another table to the query to increase up its complexity and prevent auto-parameterization, we get the same results. Rather, the difference is due to which statistics are being used, which is in turn determined by whether or not we’re using a local variable. Looking at the Estimated Number of Rows for the two plans they’re very different – 4 and 265.
An Index Seek + Lookups is a good data access strategy when the Seek returns a relatively low number of rows and there’s an index supporting the Lookups. That’s the case with the first plan with its (very accurate) estimate of 4 rows and Lookups into the Clustered Index. But the Seek/Lookup pattern doesn’t scale well, and as row counts increase you hit a “tipping point” where it actually is cheaper to Scan the Clustered Index (or another index that covers the query). That’s what’s happened in the second plan – the estimated cost of 265 Lookups (530 logical reads because the index has a depth of 2) is much higher than that of scanning the covering index (216 logical reads).
So we have a rational explanation for the differing plans, but how did they come to have such different estimated row counts?
When evaluating query plans options the Optimizer checked the statistics associated with the index on StateProvinceId. There are two values in the statistics object that offer guidance on expected row counts. One is Density – a measure of the uniqueness of any single column value in the context of the entire table. If you multiply it by the number of rows in the table…
[sql]DBCC SHOW_STATISTICS ('Person.Address', IX_Address_StateProvinceID) WITH DENSITY_VECTOR;[/sql]
[sql]SELECT 0.01351351 * COUNT(*) FROM person.Address; /* 265.05398514 */[/sql]
…you get 265! Here’s another way to arrive at 265 that might make it clearer what that value represents:
[sql]SELECT COUNT( * ) / COUNT( DISTINCT StateProvinceID ) FROM Person.Address; /* 265 */[/sql]
This is the value that’s used when your code includes a local variable. Its degree of accuracy will depend on how evenly data is distributed across a column’s values. In our case, an average value of 265 rows per column value is not a very representative value. We can see that by examining the other useful value(s) in the table – the Histogram:
[sql]DBCC SHOW_STATISTICS ('Person.Address', IX_Address_StateProvinceID) WITH HISTOGRAM;[/sql]
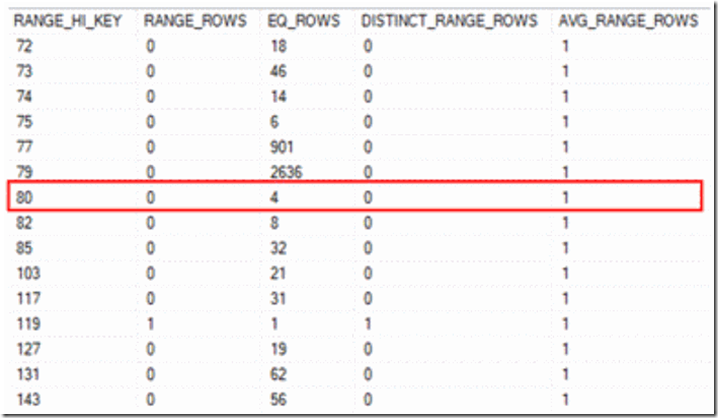
Looking at values in the EQ_ROWS column in this excerpt, you can see that none of them is anywhere near 265! But that value in the row for a RANGE_HI_KEY of 80 is spot on at 4. These are much more granular, accurate stats, and these numbers are used when your code uses literal values or stored procedure parameters.
So the bottom line is don’t test your stored procedure code using local variables – and do read Kendra’s interesting post.
One more thing not to do – don’t assign new values to your stored procedure parameters within the code – like I’m doing here:
[sql]CREATE OR ALTER PROCEDURE dbo.GetCities
@StateProvinceID INT
AS
SET @StateProvinceID += 1;
SELECT City FROM Person.Address WHERE StateProvinceID = @StateProvinceID;
GO
EXEC dbo.GetCities @StateProvinceID = 79;
GO[/sql]
The query plan to execute the stored proc performs an Index Scan, but for an entirely different reason than in our local variable example. The estimated row count for the EXEC statement is 2636 rows. Now look back at the stats histogram values for a value of 79 – it’s also 2636 rows. The query plan is based on the parameter values the proc is called with, so although we’re ultimately executing the query with a search value of 80, the plan is based on a value of 79. The recommended fix is to assign the new value to a local variable declared within the stored proc – but beware – that takes us back to the original problem!
Happy Exploring,


