Assess an Enterprise With Data Migration Assistant–Part 4: Report on an Assessment
In my previous post I took you through how to consume the assessment data into the DMAWarehouse.
In this post I’ll take you through the PowerBI report to visualize your upgrade / migration readiness.
DMA Reports
If you haven’t already downloaded the PowerBI desktop then download it here.
Open the DMA Reports PowerBI template in PowerBI Desktop.
Ensure your report connection is pointing to your own SQL Server instance which is hosting your DMAWarehouse database.
Functionality
Slicers to filter by:
- Instance Name
- Database Name
- Team Name
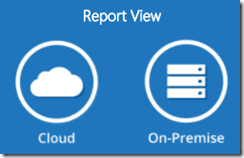
Book Marks to switch reporting context between:
- Cloud Assessments
- On Premise Assessments On
CTRL click the icon to change between cloud reports and on-premise reports.
Note – if you have only done an Azure SQL Database assessment then only cloud reports will be populated and visa versa. However, if you have done an assessment for both Azure and On-Premise and loaded both assessments into your warehouse you can switch between both reports.
If you haven’t done your assessments yet be sure to check out the first 3 parts of this series to get started.
Visuals
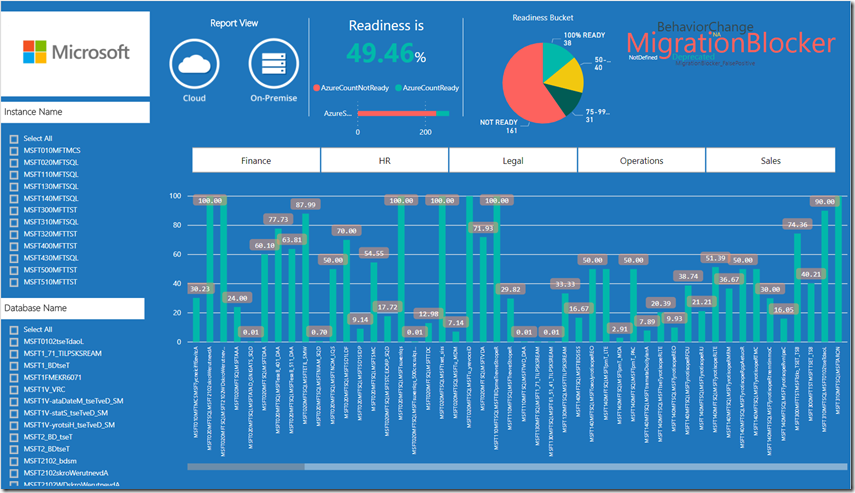
- This visual changes based on the selection context (everything, instance, database (multiples of)).
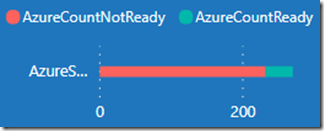
- This visual shows the count of database ready to migrate (100%) and database not ready to migrate (<100%)
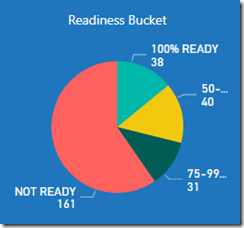
- This visual shows a breakdown of databases into the following readiness buckets:
- 100% Ready
- 75-99% Ready
- 50-75% Ready
- NOT READY
- This visual shows the issues which are currently occurring in the current selection context (everything, instance, database (multiples of)). The bigger the word, the more issues are in that category. Hovering the mouse cursor over the word shows how many of that category are occurring.
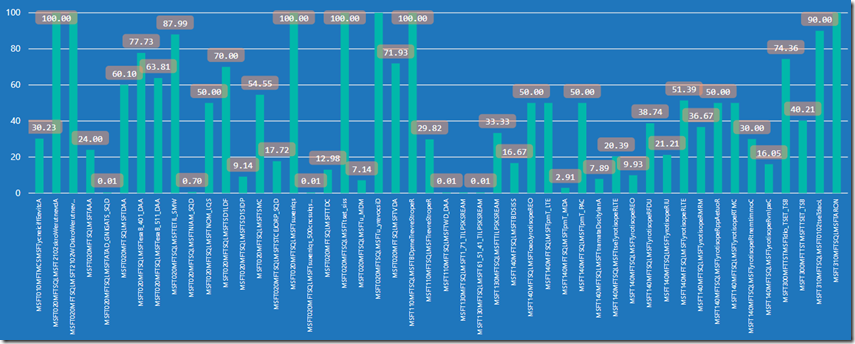
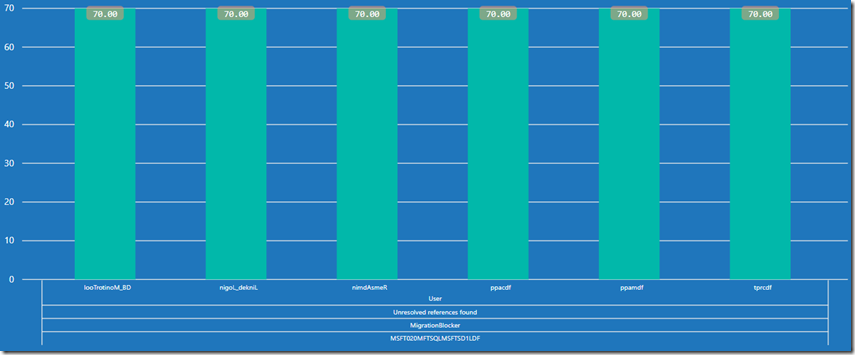
This is the main report which shows the readiness for an instance-database. This report has a drill down hierarchy of:
- InstanceDatabase
- ChangeCategory
- Title
- ObjectType
- ImpactedObjectName
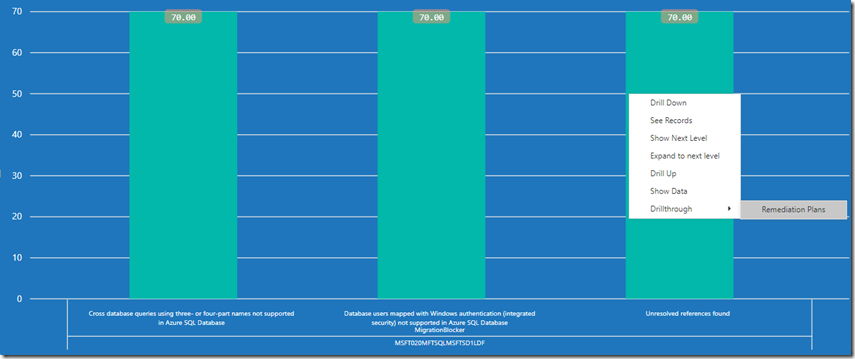
This report also acts as the filter point to create the remediation plan report.
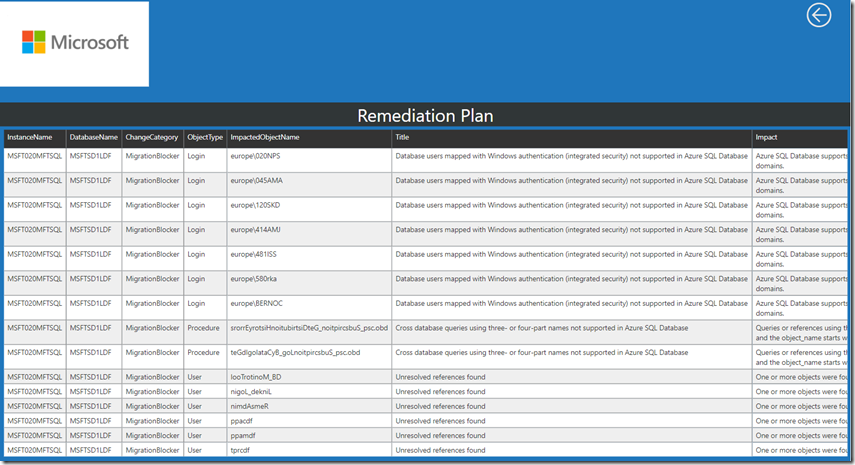
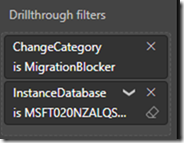
By right clicking on a data point in this graph you can drill through into the Remediation Plan Report. This will filter the remediation plan report to the current hierarchy level you are at, at the point of which you select the drill through option.
The remediation plans report can also be used on its own to build a custom remediation plan by using the filters in the “Visualizations Filters blade”
That’s the end of the series. Happy assessing !
Get the reports here
Script Disclaimer
The sample scripts provided here are not supported under any Microsoft standard support program or service. All scripts are provided AS IS without warranty of any kind. Microsoft further disclaims all implied warranties including, without limitation, any implied warranties of merchantability or of fitness for a particular purpose. The entire risk arising out of the use or performance of the sample scripts and documentation remains with you. In no event shall Microsoft, its authors, or anyone else involved in the creation, production, or delivery of the scripts be liable for any damages whatsoever (including, without limitation, damages for loss of business profits, business interruption, loss of business information, or other pecuniary loss) arising out of the use of or inability to use the sample scripts or documentation, even if Microsoft has been advised of the possibility of such damages. Please seek permission before reposting these scripts on other sites/repositories/blogs
