Introducing the CodePlex Projects Stats Pages (10 March 2008 Deployment)
Yesterday, we deployed our latest CodePlex feature – Project Stats Pages. These project stats pages provide details for downloads, page views, visits, and referrals over the project lifetime. Additionally, the project’s stats can be viewed in weekly, monthly, and yearly segments. Visit any CodePlex project to check out the new stats pages, or go to the Stats FAQ for more information.
We display the stats data using the Telerik RadChart, and we obtain page views, visits, and referrals from WebTrends.
Breakdown of stats available for each project:
· Downloads - downloads includes all publicly available releases, source code changesets, and wiki attachments
· Page Views - page views indicate the total number of views on any page on the project
· Visits - a visit is a series of one or more page views from the same browser within a short timeframe
· Referrals – the list of referring sites
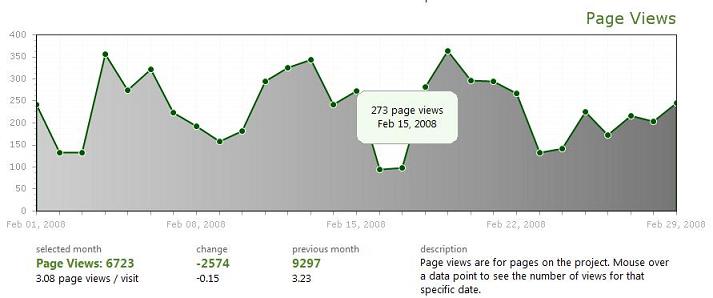
For example, using the xUnit project, here’s what the stats look like for the month of February. In the graph below, there were 273 page views on Feb 15, 2008.

Enjoy!
Comments
Anonymous
March 13, 2008
New CodePlex Feature: Stats PageAnonymous
August 08, 2008
Publicación del inglés original : Miércoles, 6 de agosto de 2008 2:53 PM PST por Somasegar Parece queAnonymous
August 18, 2008
It seems like only recently, but is has been two years since we launched CodePlex . We launched thisAnonymous
August 18, 2008
原文地址: CodePlex celebrates its 2nd birthday! 原文发表时间: Wednesday, August 06, 2008 9:31 PM 虽然发布时的情景还列列在目