NGen: Measuring Working Set with VMMap
This is article 3 of 4 in the NGen: Walk-through Series .
This article is part of a series of blog posts intended to help managed code developers analyze if Native Image Generation (NGen) technology provides benefit to their application/library. NGen refers to the process of pre-compiling Microsoft® Intermediate Language (MSIL) executables into machine code prior to execution time.
Working set is the amount of physical memory that has been assigned by the operating system to a given process. For managed applications, NGen helps to reduce the working set in 2 ways: the application will not need to load the JIT into the process (process specific benefit), and the native image for a library will be shared across multiple managed applications running at the same time (machine wide benefit). As with everything performance related, you can only decide whether using NGen benefits working set for your application by measuring it. This article will walk through how to perform such measurements and what to watch for.
This article contains the following sections: Getting Started with VMMap, The Basics: Is the JIT getting loaded?, The Basics: Using the GAC, Impact of Base Address Collisions (Rebasing): Pre-Vista, Impact of Base Address Collisions (Rebasing): What about Vista?, Cross-Process Sharing of Native Images, Wrapping it up!
Getting Started with VMMap
Download: https://technet.microsoft.com/en-us/sysinternals/dd535533.aspx
VMMap is a handy tool that provides visualization for process memory usage. In order to easily launch it on a currently running process, use the command “vmmap.exe –p <name_of_process_exe>”.
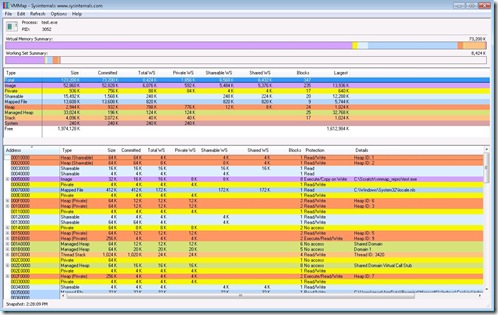
Screenshot 1: Overall View
In Screenshot 1 above, observe the various memory types listed in the rows in the upper pane (Image, Private, Shareable etc.). For each memory type (for example, Private), there are several columns that detail how that memory type breaks down; how much is the Committed memory, Total Working Set, Private Working Set, Shareable Working Set etc. Note that the precise definition of each of these is available from the Help->Quick Help menu in the UI. The Image memory type is easier to use for tracking purposes because it maps to the executable file that launched the current process being analyzed. It also enables a drill down into which other files were loaded into the process and how much of memory they consume. The goal here is to reduce the Total WS (benefits the application) and reduce the Private WS (could benefit the machine wide resource usage).
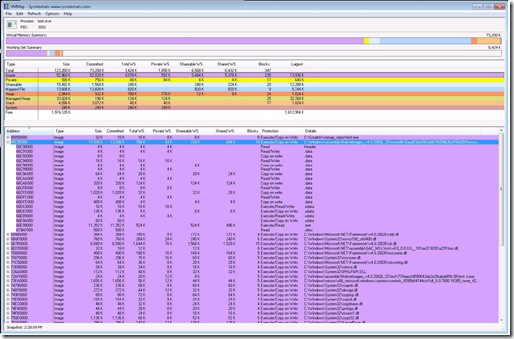
In order to see the detailed break-down of the Image memory type, in the upper pane, select the row named Image. The lower pane will now display the list of all files loaded into this process and the resource usage of each file. See Screenshot 2 below.
Screenshot 2: Image memory type view
For each file (file name is visible in the right-most Details column, see Screenshot 2 above), the resource usage of the file is further broken down into Size, Committed, Total WS, Private WS, Shareable WS and Shared WS. We are interested in the working set columns (Total, Private, Shareable and Shared).
Let’s understand one of the rows shown above, for the file mscorlib.ni.dll.
Size = 13,936K. This refers to the size of the image which comes from the PE header of the file. For the curious, to see where this number comes from, do the following: From a Visual Studio SDK command prompt use “link.exe /dump /headers <PathToFile>”, and look under the Optional Header Values for “size of image” in hex.
Committed = 13,936K. This is the amount of allocation backed by virtual memory.
Total WS = 788K. This is the amount of physical memory that is assigned to this file.
Private WS = 64 K. Of the total physical memory assigned to this file, this amount cannot be shared with other simultaneously running processes that also need this file.
Shareable WS=724K. Of the total physical memory assigned to this file, this amount could be shared with other simultaneously running processes that also need this file.
Shared WS = 684K. Of the total Shareable working set, this is the amount that is currently being shared with another process that also needs this file. If there were no other process that needs this file, this number could be 0.
Supported Environments: Windows XP and newer Operating Systems. 32 bit and 64 bit.
Further Reading
1> VMMap: https://technet.microsoft.com/en-us/sysinternals/dd535533.aspx
The Basics: Is the JIT getting loaded?
One of the quickest ways to reduce the total working set of a managed application is to ensure that only essential modules get loaded into the process.
If the application and its entire closure of dependencies has been NGen’d, in the general case it is expected that the JIT will not get loaded. In the Details column in the lower pane of VMMap, check that clrjit.dll (.Net Framework v4.0) or mscorjit.dll (Pre-.Net Framework v4.0) has not been loaded. If it has been loaded, it indicates that something within your application is getting JIT-ed. This may be an entire dependency that was not NGen’d or it may be a few methods within an assembly for which native code could not get generated. For the former case, Fusion Log Viewer can be used to determine the assembly for which a native image could not be found. For the latter case, the JIT Managed Debugging Assistant helps answer the question around which method the JIT is getting invoked for. See the links below in Further Reading for details on how these tools can be used.
Working Set Impact: When the JIT is loaded into the process, it contributes ~200K to the Total WS. This does not seem like a whole lot when looked at independently. However, in order to invoke the JIT, the CLR’s engine itself executes more code and as a result more pages from the engine’s DLL (called clr.dll in .Net Framework 4.0 or called mscorwks.dll in prior releases) are pulled into the Total WS. In the example I used, the Total WS of clr.dll went up by ~100K. That’s not all. Since a particular assembly say A.dll (or a part of it) needed to get JIT compiled, the IL for that assembly also needed to be loaded. Depending on the size of this assembly (or the size of the method that needed to be JIT compiled), the IL also contributes to the Total WS. Moreover, since the JIT compiled code cannot be shared across process boundaries, if A.dll was also needed subsequently by another process on the machine, that new process would need to incur its own Total WS cost to JIT compile the code.
Of course, if the size of the assembly (or method within the assembly) being JIT compiled is small, you may not care about this working set hit. Doing your own measurements will help you reach a decision.
Further Reading
1> Fusion Log Viewer: https://msdn.microsoft.com/en-us/library/e74a18c4.aspx
2> JitCompilationStart Managed Debugging Assistant (MDA): https://msdn.microsoft.com/en-us/library/fw872k46(VS.80).aspx
The Basics: Using the GAC
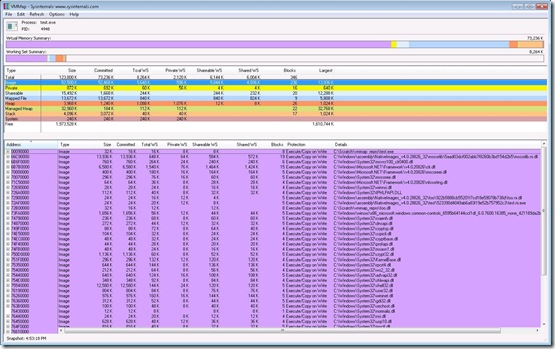
In some cases, even when the JIT does not appear in the list of modules loaded in the process, it is possible that both the IL as well as the native image will get loaded for a particular assembly. Note that the application’s main executable will be listed twice in VMMap – the first listing corresponds to mapping the IL and the second corresponds to loading the native image. This is expected. See Screenshot 3 below. Note that when a native image is loaded for an assembly, the Details column will show a path of the type C:\Windows\assembly\NativeImages_*.
Screenshot 3: Example of both IL (foo.dll) and native image (foo.ni.dll) contributing to Total WS
However, for any other managed assembly in the list of modules in the process, having both the IL and the native image contribute to Total WS may be preventable. A couple of the main reasons why both IL and native image may appear loaded are if the assembly is a mixed-mode assembly or if the assembly being loaded lives outside the GAC. For the former case, loading of both IL and Native Image for a mixed mode assembly is not preventable. In the latter case, installing the assembly into the GAC will stop the additional load of the IL. Again, it is important to keep in mind that the additional load of the IL assembly depends on the size of the assembly itself – it may not be large enough to make you want to install the assembly into the GAC.
Aside: Speaking of the GAC, prior to .Net Framework 3.5 SP1, it was strongly recommended that all strong name signed libraries used by an application be installed into the GAC. The reason was that the for strong name signed assemblies outside the GAC, the CLR would need to load the entire IL assembly and compute a hash over its contents and compare it with the assembly’s signature before permitting the load of the native image for security reasons. Starting with .Net Framework 3.5 SP1, a feature called strong name bypass eliminates the need to compute this hash for full trust cases. In Screenshot 3, the assembly foo.dll is strong name signed and outside the GAC. The IL still gets mapped and contributes to Total WS, but we do not incur an additional working set hit from clr.dll for computing the strong name hash. As an experiment, if the strong name bypass feature is disabled, the working set for clr.dll will be higher.
Further Reading
1> Strong Name Bypass: https://blogs.msdn.com/shawnfa/archive/2008/05/14/strong-name-bypass.aspx
Impact of Base Address Collisions (Rebasing): Pre-Vista
When rebasing occurs, the Private WS increases and the Shareable WS decreases; this is not optimal for machine-wide memory usage. Let’s look at why rebasing affects working set.
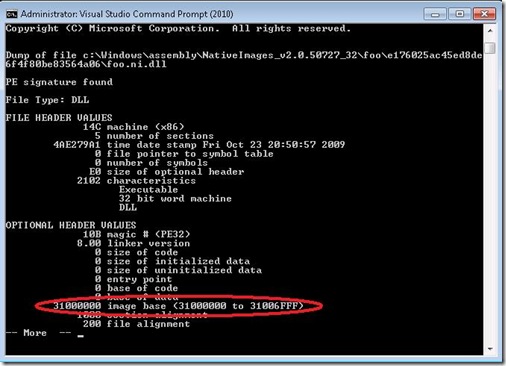
Native Images typically get loaded at an address that is specified in its PE Header. From a Visual Studio Command Prompt, do a “link.exe /dump /headers <PathToNativeImageFile>”. Screenshot 4 below shows this.
Screenshot 4: Preferred Base Address
So who chooses the base address? Unless you specify a base address during compile time (for instance, via the /baseaddress option to csc.exe), the CLR will pick one! If a base address was not specified during compile time, the compiler assigns a default base address of 0x4000000. When creating a native image, the CLR translates this default address for an executable to 0x30000000 and for a DLL to 0x31000000. Screenshot 5 shows the DLL default above, as picked by the CLR. This address is the one used by the operating system to load the PE file at. VMMap shows which address was used in the very first column “Address” in the lower pane.
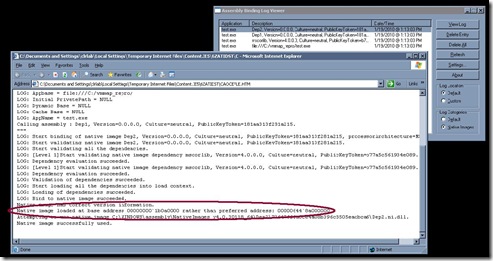
Naturally, if there are multiple managed DLLs loaded into the process with the same preferred base address assigned, not all can be loaded at the same address. The first DLL native image to be loaded will occupy 0x31000000 and all subsequent DLL native images will get loaded at other addresses; this is called rebasing. The SDK tool Fusion Log Viewer will log when a native image gets rebased. You should expect to see a message similar to the one shown in Screenshot 5 below, if rebasing occurred.
Screenshot 5: Fusion Log Viewer indicating rebasing of a native image
Let’s take a quick look at why rebasing is bad. Each native image contains absolute addresses that are references to items (like strings) within the native image itself. If the native image gets loaded at an address other than the preferred base address, the CLR needs to adjust those references (also known as performing fixups) – this is done by writing to the page that contains the reference, thereby creating private pages that cannot be shared with other processes that might also want to load the same native image. Using VMMap, when rebasing occurs, the Private WS number increases and the Shareable WS decreases. This is not optimal for total machine wide memory usage.
The use of hard binding further complicates this analysis. Note that if the managed application utilized hard binding for native images, when the application launches, the hard bound dependencies get loaded first before the application. In case any of the hard bound dependencies gets rebased, the dependency itself will need to have fix ups, creating private pages. However, the application’s native image that stores references to this dependency native image will need fixups as well. The application’s Private WS will increase for two reasons – once for the rebased dependency and once for the assembly that depends on this rebased dependency.
Remember when using VMMap: For Total WS and Private WS – lower is better. For Shareable WS – higher is better.
Further Reading
1> NGen and Rebasing: https://msdn.microsoft.com/en-us/magazine/cc163610.aspx#S5
2> Hard Binding of Native Images: https://msdn.microsoft.com/en-us/magazine/cc163610.aspx#S7
Impact of Base Address Collisions (Rebasing): What about Vista?
Starting with .Net Framework 3.5 SP1, on Vista machines (and newer Windows operating systems), native images are opted into an OS security feature called ASLR (Address Space Layout Randomization). Essentially, the Operating System ignores the preferred base address in the PE file header of a native image, and loads it at a random base address. As a result, it does not matter what preferred base address was assigned to a library, it will not be used.
As mentioned above, if your application’s distribution is restricted to Vista or newer operating systems, base address collisions is a class of problems that goes away.
Further Reading
1> Address Space Layout Randomization: https://technet.microsoft.com/en-us/magazine/2007.04.vistakernel.aspx
Cross-Process Sharing of Native Images
One of the benefits of having native images is that they can be shared across multiple managed processes on a machine. This is particularly helpful for server scenarios where there may be multiple managed applications running on the machine, that depend on a common set of managed libraries. If an application has already loaded a native image, and a second application is started that uses the same native images, the pages from the native image that are still marked shareable, will be shared. The second application will not incur a working set hit for those pages.
Let’s look at this using VMMap.
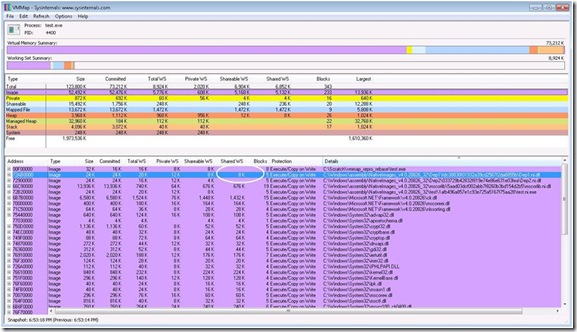
Screenshot 6: Shareable WS becomes Shared WS with multiple managed applications
Assume that Dep1.dll is our library that could potentially be shared. In VMMap, for the native image for foo.dll, the “Shareable WS” is listed as 8K, and the “Shared WS” is nothing. This indicates that an 8K chunk of memory in the native image for Dep1.dll is available for sharing, in case another process wanted to share it. When we launch a second application that also uses Dep1.dll, hit the Refresh option in VMMap to show the new working-set numbers. We’ll now see that the “Shared WS” number is 8K. This indicates that of the memory from Dep1.ni.dll that was available for sharing, we shared all of it.
Wrapping it up!
That summarizes the very basics of using VMMap to analyze the impact of NGen on the working set of a managed application. This article hopefully articulates how VMMap can be used and points out what to watch for during the measurements. We’d love to hear what you think! Have you used VMMap in the past to analyze the impact of NGen? If not, what do you use? How was your experience? Please use the comments section below for any feedback, questions and tips you’d like to share.
Pracheeti Nagarkar
CLR Codegen team
Comments
- Anonymous
June 30, 2010
We are developing a mixed WPF/WinForms based .NET application that uses a lot of assemblies. When I run NGEN on my assemblies, then they use a lot of additional private WS for the image part. I guess this is caused by ASLR that needs to fix-up all my assemblies.The NGEN version requires 51MB private WS for the image type, where the non-NGEN version requires only 12MB private WS. Some of my assemblies are mapped into memory twice that requires another 28MB of shared WS memory. I guess only the assemblies that contain resources are mapped twice.The only benefit of the NGEN version seems that the heap and managed heap are a bit smaller. Normal heap is 48MB (non-NGEN) versus 41MB (NGEN) and the managed heap is 45MB (non-NGEN) versus 41MB (NGEN).It seems that in my situation it isn't useful to use NGEN, because the total private WS grows from 218MB (non-NGEN) to 277MB (NGEN). The private WS (most important for Citrix systems) grows from 157MB to 185MB. Maybe it is a good idea to rebase all assemblies and switch of ASLR completely.Can you comment on this issue? - Anonymous
February 08, 2011
Which version of .Net are you using? Is that .Net 4.0 or 3.5? 3.5 ASLR support is not particularly great, as it can cause serious private working set issues. If you're seeing these kind of private WS issues, I believe our Perf team would be interested in further investigation. - Anonymous
October 23, 2012
I am using .NET 3.5 and my application uses 290 MB of Working Set (10 MB managed heap) when one instance of app is deployed. When two instances of the same app are deployed it takes 390 MB of heap for each instance. Will the NGEN technology help reduce the memory footprint of the apps in this case. Particularly if we have 10 different apps deployed in the same machine.
