The Case of the 2 Million Context Switches
This week I was in Denver, CO handling a high CPU performance issue with Microsoft BizTalk Server 2006 R2. The customer was seeing very high CPU utilization even when BizTalk doesn’t have any real work do to, so this was a bit of a mystery and a challenge. I like challenges. ;-)
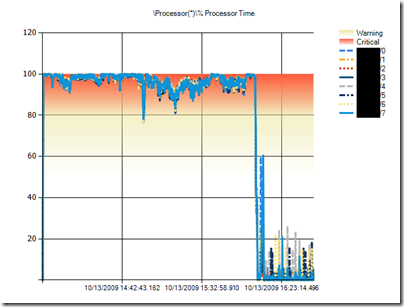
Symptoms: High processor utilization over 90% across all 8 processors.
Relevant Configuration
- Microsoft Windows Server 2003 (x64)
- Microsoft BizTalk Server 2006 R2 (x64)
- 2xQuad Core (8 processors) AMD Opteron
First, I verified that the server is in fact using a high amount of CPU by taking performance counter logs of the servers. Sure enough the BizTalk Servers were having high CPU consumption.
The black block is just removing the server names to protect privacy.
By the way, it’s worth mentioning that the above chart was created using the upcoming release of Performance Analysis of Logs (PAL) v2.0 tool. I’ve been working on it nearly every night for the past year. Look for it to be released soon at Microsoft’s open source web site at https://pal.codeplex.com. Got a performance issue, PAL it!
The next step to diagnosing high processor conditions is to determine the ratio of privileged mode to user more CPU. Threads executing on processor can only be in one of these modes and this is the fork in the road that determines our next step in troubleshooting. The counter “\Processor(?)\% Processor Time” is the sum of “\Processor(?)\% Privileged Time” (also known as kernel time) and “\Processor(?)\% User Time” where the question mark (?) indicates the same counter instance such as _Total and 0.
Using PAL v1.0 (PAL v2.0 doesn’t have % Privileged Time analysis functional yet) to generate chart and alerts on the counters, it showed that the % Privileged Time counter is taking up roughly 40% of the total CPU. Under normal conditions, privileged time shouldn’t be higher than 10% of total CPU, so this is a very high amount of time being spent in the kernel.
A high amount of kernel mode time typically indicates a high amount of device driver, hardware, or context switching.
PAL did not alert on any disk or network I/O which can be driver related, but it did light up like a Christmas tree on “\System\Context Switches/sec”!
Again, the black box in the image above is removing the server name to protect privacy.
A normal amount of Context Switches/sec is about 1,000 or less. Today’s processors are able to handle high amounts of context switches per second and the chart above (done with PAL v2.0 I’m proud to say) shows over 2 million context switches/sec. This is a testament to my previous statement. In my entire career, I have never seen Context Switches/sec go above 100,000, so this is the most extreme case I have ever seen. So… as they say in Mythbusters… “Now, there’s your problem!”.
According to Performance Monitor, “Context switches occur when a running thread voluntarily relinquishes the processor or is preempted by a higher priority ready thread.”
Processor utilization in the BizTalk processes (BTSNTSVC64.exe) correlates with the high CPU.
Multi-threaded applications like BizTalk Server can use up to 100% times the number of processor on the server, so since this server has 8 processors any one process could potentially take up to 800% CPU. This is why we see “\Process(BTSNTSvc64)\% Processor Time” consuming 207% CPU.
At this point, we have proof that BizTalk Server processes are consuming the most CPU and most of that CPU consumption is in privileged mode (kernel mode) CPU. The processes are hitting the BTSNTSvc.exe file extremely often, and the most likely process doing all of the context switches/sec.
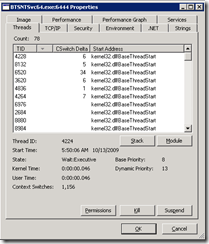
What do we do now? The next logical step is to profile the process to determine what it is doing. There are many profilers out there and different techniques. The first we tried is not a dedicated profiler, but works on native (non-.NET code). We tried Process Explorer (a SysInternals tool owned by Microsoft). It showed the BizTalk processes as consuming high CPU. A nice feature is to go to properties on the process and click the Threads tab.
If you have the Debugging Tools for Windows installed, then you will see the threads and the functions that each of the threads are currently working on. In this case, we see all of the threads on Base ThreadStart indicating that there is seems to be a lot of thread creation or the call stack is not correct.
I mentioned the high CPU symptoms to my BizTalk colleagues Todd Uhl and Brian Gregor. Both of them pointed me to the article below. Thanks again, guys! The hotfix that was created for BizTalk was because of a condition where the exception handler in one function would attempt to retry a condition that was failing.
FIX: A CPU usage spike occurs on all the BizTalk hosts after you install security bulletin MS07-040 on a server that is running Microsoft BizTalk Server 2006 or Microsoft BizTalk Server 2006 R2
https://support.microsoft.com/?id=943165
After applying this hotfix (943165) on the servers, CPU utilization on the BizTalk servers dramatically came down to about less then 5% compare to nearly 100% CPU consumption. Therefore, this hotfix was the *big fix* and it sounds like it should be applied to ever x64 BizTalk Server 2006 R2 server especially if you are seeing unnaturally high CPU consumption. With that out of the way, we still had one BizTalk server still using up 25% CPU across all 8 processors, so we focused our attention to it next.
We tried running the stand alone Visual Studio Profiler tool to sample the BizTalk process. Unfortunately, we were not able to get it working due to a conflict with a third-party profiler already installed on the server. :-(
Take a look at one my of older blog postings where I profiled IIS and check out my HowTo article on how to use this tool in a production environment.
Finally, the old hammer way which is still useful is to get full process dumps of the high CPU process. You do this by installing the Debugging Tools for Windows (safe to install on production servers) and using the ADPlus tool to create hang dumps. Each dump takes an image of the process and dumps all of it’s memory to disk in a DMP file. This procedure is similar to taking a picture of someone doing work, then assuming that is what they are doing with all of their time. This is why profilers are better because profilers sample the threads periodically similar to having a video camera on the person doing work versus taking pictures here and there.
We took about 5 process dumps of the BizTalk process by opening a command prompt, changing directory to the installation directory of the Debugging Tools for Windows, then running the following command:
CScript ADPlus.vbs –hang –p 6444 –o C:\DebugOutput
This pauses the process and writes all of it’s memory to disk in a DMP file under the directory specified by the “-o” parameter. 6444 is the process ID of the BizTalk process. This typically takes less than 30 seconds to dump the process out and the process is resumed where it left off like nothing happened.
We took about 5 process dumps about 30 seconds a part from each other. The idea is to compare the dumps to get an idea of what the threads are doing when at high CPU. Ideally, we want to see the same call stack many times to establish what the threads are likely doing. For example, if you took a picture of someone jumping, then you wouldn’t want to assume that they are suspended in mid-air all day.
By the way, I’m proud to say that I am good friends with the original author of ADPlus.vbs, Robert Hensing.
The procedure of taking full user dumps to diagnose proved to be very useful because the call stacks on the active threads (threads doing real work) was identical in every dump. We analyzed them by using them up in WinDBG which is part of the Debugging Tools for Windows.
In WinDBG, we set our symbol path to point to Microsoft’s public symbol server using the following path:
SRV*C:\Symbols*https://msdl.microsoft.com/download/symbols
Next, we opened up each DMP file and executed the “!runaway” command (without the double quotes) which shows us which threads have consumed the most CPU over the life of the process.
The following output is similar to what we found.
0:000> !runaway
User Mode Time
Thread Time
57:1418 0 days 16:35:51.812
56:1410 0 days 3:15:13.171
69:14b0 0 days 0:01:32.546
68:14ac 0 days 0:01:21.984
44:f3c 0 days 0:01:12.406
42:3b4 0 days 0:01:06.562
70:14b4 0 days 0:01:02.781
49:135c 0 days 0:00:59.953
10:11f8 0 days 0:00:53.734
6:f88 0 days 0:00:52.015
5:1e4 0 days 0:00:51.500
This shows that thread 57 and 56 are the threads that have consumed the most CPU.
To change to the thread we type in “57s”. This is similar to changing into a directory at the command prompt. After that we typed in “kb” which shows us the call stack of the thread. In this case, the call stack we found looked something like this (modified for simplicity and privacy):
Custom.Method1
Custom.Method3
Custom.Method2
Custom.Method1
Custom.Method3
Custom.Method2
Custom.Method1
BTS.Streaming.MarkableForwardOnlyEventingReadStream.ReadInternal
BTS.Streaming.EventingReadStream.Read
BTS.Component.XmlDasmComp.HasData
In this call stack, we see a repeating pattern of Method1 calling Method2, Method2 calling Method3, and Method3 calling Method1. I am certainly not a very good BizTalk developer, but there is a repeating pattern here. At this point, we discussed our findings with the customer’s BizTalk developers and with luck try to optimize it.
Conclusion
The BizTalk hotfix 943165 had the most significant impact on the CPU consumption on the BizTalk Server and was the big fix in this case. With that said, most high CPU problems require digging into call stacks to identify what the threads are doing most of the time. There are quite a few third party profilers out there that make this process relatively painless, but be careful about using them in production environments and stick to sampling based profilers if you can. They provide better results in production environments.
Lesson Learned
If you are running the x64 version of Microsoft BizTalk Server 2006 R2, then you need this hotfix (943165).
I hope this posting is helpful with showing you how to look at call stacks using WinDBG and remember… all performance problems can be solved, but like city traffic, it just takes time and effort.
Comments
Anonymous
January 01, 2003
Thanks. :-)Anonymous
March 06, 2012
awesome article :DAnonymous
July 02, 2013
Brilliant article! Just the sort of detail that helps me understand what I'm seeing on my own Root Cause excursions. Thanks heaps ClintAnonymous
October 26, 2015
Its AWESOME, and now its 2015, your article still rocks :P- Anonymous
September 06, 2016
Thanks! :-)
- Anonymous


