SQL Server on Linux: Debugging ELF and PE Images (dbgbridge)
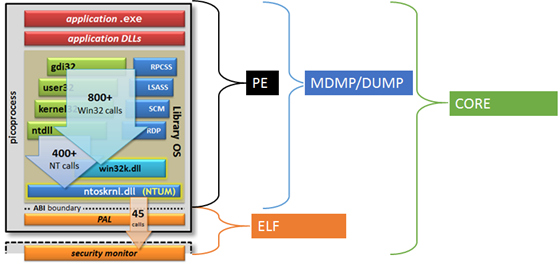
In my last post I highlighted the marriage of PE and ELF images within the same process space to build SQL Server on Linux. In this post I will expand upon the dbgbridge component, as mentioned by Slava in his latest channel 9 video.
The dbgbridge (Debugger Bridge) is a critical component in the SQL Server on Linux evolution. A year before I joined the development team I worked on the supportability aspects of SQL Server on Linux. There are lots of avenues for supportability (error messages, logging, documentation, data collection, …) The bed rock for developing and supporting software sometimes comes down to the good old fashioned source and symbols. As you would imagine, the ability to debug SQL Server on Linux, end-2-end, was among the top of our list.
When you mix PE and ELF images you are also mixing the symbol formats and other information used for debugging. Many of you have used WinDbg, Visual Studio or other other debugging utilities but none of these are designed for PE and ELF in the same process space. These debuggers often handle a pure PE or ELF process but not a mixed environment.
You can always debug the SQL Server on Linux from assembly but assembly is often too low level for general debugging needs and efficiency. The ability to do source level debugging and use other features of such debugging utilities is critical to productivity.
The building blocks for dbgbridge include Microsoft and Open Source components allowing dbgbridge to create a single debugger experience. Developers and support engineers can use the same scripts, commands and other capabilities they have been using for years.
WinDbg
The WinDbg debugger is supported by the set of API interfaces exposed in the symsrv, dbghelp and dbgeng dlls. The same dlls are used for the command line debugger (cdb.exe), SQLDumper.exe and other utilities. The dll’s understand PE image format and the associated symbols (PDBs.) There is also a protocol for remote debugging (remote.exe, .server command, etc.) The remote protocol allows an instance of WinDbg to connect (tcp, named pipes, …) to a target, usually on another machine.
- Machine A – Running WinDbg, containing the symbols and source needed for debugging.
- Machine B – Running the remote stub, attached to the target. (Target can be a live process or a dump file.)
Setting a breakpoint often involves replacing assembly instructions. Machine A forwards a write request to the stub on Machine B which writes to the target’s memory. Symbolizing the stack involves reading memory so Machine A forwards a read request to the stub on Machine B and so forth,
LLDB
WinDbg works great for the PE components of SQL Server on Linux but how do we debug the parts of the process that are supported by ELF format? This is where the LLDB debugger comes into the picture. Much like the dbg* dlls provide the API interfaces, LLDB has a similar interface ABI which can be used to debug ELF based images.
dbgbridge
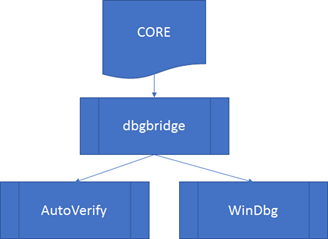
The dbgbridge is a native, Linux executable (ELF), implementing the remote interface needed by WinDbg, translating the WinDbg requests into LLDB ABI calls.
When a breakpoint needs to be set WinDbg sends the same write request to dbgbridge. The dbgbridge calls the proper LLDB ABI to complete the write against the target process.
Using WinDbg with dbgbridge makes it possible for the PE and ELF portions of SQL Server on Linux to be debugged in a single session. In fact, any utility based on the dbg* API interfaces functions against a Windows (PE) or Linux (ELF) based target that supports dbgbridge.
Live Process and Dumps
The Windows and LLDB debuggers provide capabilities to start an application under the debugger, attach to a running process or loading a captured dump file. This allows the same design to handle live and offline debugging scenarios.
Dump Formats / State Captures
Just like PE and ELF formats are different so to are the dump formats used on Windows and Linux. The formats are similar but not the same. Again, the debuggers are able to handle the respective formats. Windows uses MDMP or DUMP and LLDB the ELF CORE format. If you open a dump, in a hex editor, you can see the signature as the first 4 bytes.
The combination of the Windows and LLDB debuggers, alongside of dbgbridge, expose many ways to capture process states.
| CORE dumps | ELF format containing the entire process space (PE and ELF components.) |
| Windows dumps | Windows format containing only the PE components. |
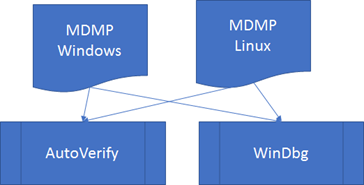
SQL Server can happily run and when it is needed, invoke SQLDumper generating the same MDMP for SQL Server on Linux as on Windows installation. The same tools, training and investigation of a problem with SQL Server on Windows applies to the SQLDumper captures from SQL Server on Linux. In fact, you can capture the SQLDumper (.mdmp) from the Linux installation, copy it your Windows desktop, open it with WinDbg and use the Microsoft Symbol Server.
* AutoVerify is a development and support tool, built upon the Windows Debugger API, used to automatically process MDMP or DUMP based files.
When an issue occurs that can’t be handled by SQLDumper a core dump is captured. The core dump can’t be directly opened by WinDbg, AutoVerify or other Windows debugger based utilities. However, it can be opened using dbgbridge.
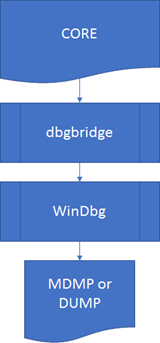
Note: Using the Windows Debugger and dbgbridge the ( .dump) command can be used to extract the PE portion of the CORE dump.
Thread back trace in PE and ELF
As the thread is running it transitions in and out of various states across the PE and ELF based images. The combining of the WinDbg and LLDB make it possible to see the entire stack of execution. Here is an example.
| ELF | __pthread_cond_timedwaitstd::__1::condition_variable::__do_timed_waitstd::__1::cv_status std::__1::condition_variable::wait_forObjectWaitContext::Wait(long*) ObjectWaitContext::WaitForSignalObjectManager::WaitForAnyObject ObjectsWaitAny+0x48 ObjectsWaitAny_ntabi_thunk |
| PE | ntoskrnl!NtpWaitForAnyOfMultipleObjectsntoskrnl!NtpWaitForMultipleObjectsInternalntoskrnl!NtpWaitForAndProcessIoCompletionntoskrnl!NtpRemoveIoCompletionInternalntoskrnl!NtpWaitForWorkViaWorkerFactoryInternalntoskrnl!NtWaitForWorkViaWorkerFactoryFromUmntoskrnl!InvokeSystemCallHandlerntoskrnl!SystemCallEntryntdll!TppWorkerThreadKERNEL32!BaseThreadInitThunkntdll!RtlUserThreadStart |
As you can see this makes dbgbridge an indispensible part of the toolkit for developing and supporting SQL Server on Linux.
Bob Dorr – Principal Software Engineer SQL Server


