Easy way to get statistics histogram programmatically
Cross post with https://aka.ms/sqlserverteam
Statistics being the building blocks on which the Query Optimizer reasons to compile a good enough plan to resolve queries, it’s very common that anyone doing query performance troubleshooting needs to use DBCC SHOW_STATISTICS to understand how statistics are being used, and how accurately they represent data distribution.
Let’s see how to use this. Take the following simple query:
 USE [AdventureworksDW2016CTP3]
GO
SELECT * FROM FactResellerSales
WHERE OrderDate BETWEEN '20110101' AND '20110606'
GO
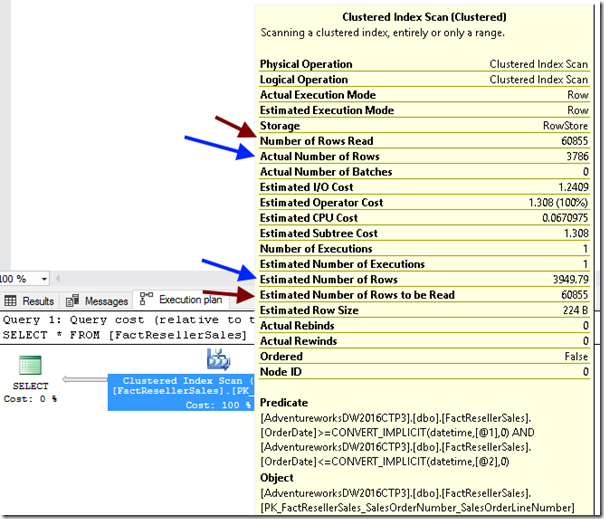
This is what we get as an execution plan, we can see how many rows were read and estimated to be read (red arrows), plus the estimated and actual rows after predicate is applied (blue arrows):
Let’s say you wanted to understand where the estimation came from, then naturally you will want to look for whatever stats object references that single column (using a single column predicate for simplicity sake). If you need to programmatically access this data, then usually you would dump DBCC SHOW_STATISTICS … WITH HISTOGRAM to a table, and then use it from there. That is not ideal.
With the latest release of SQL Server 2016 SP1 CU2, we added a new Dynamic Management Function (DMF) sys.dm_db_stats_histogram, which is similar to running the above DBCC statement. Note: this DMF is also available in SQL Server vNext CTP 1.3.
SELECT * FROM sys.dm_db_stats_histogram(OBJECT_ID('[dbo].[FactResellerSales]'), 2)
This further completes the story we started with sys.dm_db_stats_properties, which has a similar output to running DBCC SHOW_STATISTICS … WITH STATS_HEADER.
SELECT * FROM sys.dm_db_stats_properties(OBJECT_ID('[dbo].[FactResellerSales]'), 2)
But to make it more interesting, here’s one example on how you can leverage these DMFs inline, to get information on which stat and respective histogram steps cover my predicate, in the scope of my table and column:
 SELECT ss.name, ss.stats_id, shr.steps, shr.rows,
    shr.rows_sampled, shr.modification_counter, shr.last_updated,
    SUM(sh.range_rows+sh.equal_rows) AS predicate_step_rows
FROM sys.stats ss
INNER JOIN sys.stats_columns sc
    ON ss.stats_id = sc.stats_id AND ss.object_id = sc.object_id
INNER JOIN sys.all_columns ac
    ON ac.column_id = sc.column_id AND ac.object_id = sc.object_id
CROSS APPLY sys.dm_db_stats_properties(ss.object_id, ss.stats_id) shr
CROSS APPLY sys.dm_db_stats_histogram(ss.object_id, ss.stats_id) sh
WHERE ss.[object_id] = OBJECT_ID('FactResellerSales')
    AND ac.name = 'OrderDate'
    AND sh.range_high_key BETWEEN CAST('20110101' AS DATE) AND CAST('20110606' AS DATE)
GROUP BY ss.name, ss.stats_id, shr.steps, shr.rows,
    shr.rows_sampled, shr.modification_counter, shr.last_updated
The output below let’s me see that my predicate matches 3949.79 rows in the affecting histogram steps, which is exactly what I observed in the actual execution plan.
Note: because the column range_high_key is a sql_variant data type, you may need to use CAST for proper comparison as seen above.
Pedro Lopes (@sqlpto) – Senior Program Manager


