Remote debug your Azure App Service 2017 including ASP.NET Core
We are moving at cloud speed here, I wrote this one here less that a year ago “Remote debug your Azure App Service Web App” that discusses how to use Cloud Explorer to remotely attach a debugger to an Azure App Service in Visual Studio 2015, now let’s see how you can do the same in 2017…
To configure and remote debug your Microsoft Azure App Service Web App, you will need to perform the following:
- Have a Web App deployed to the Azure platform
- Attach the remote debugger to the Web App
- Confirm the remote debugger is attached to the W3WP process
- Set the break points
- Execute the process which is rendering the exception, performing slow or in an unexpected manner
Attach the remote debugger to the Web App
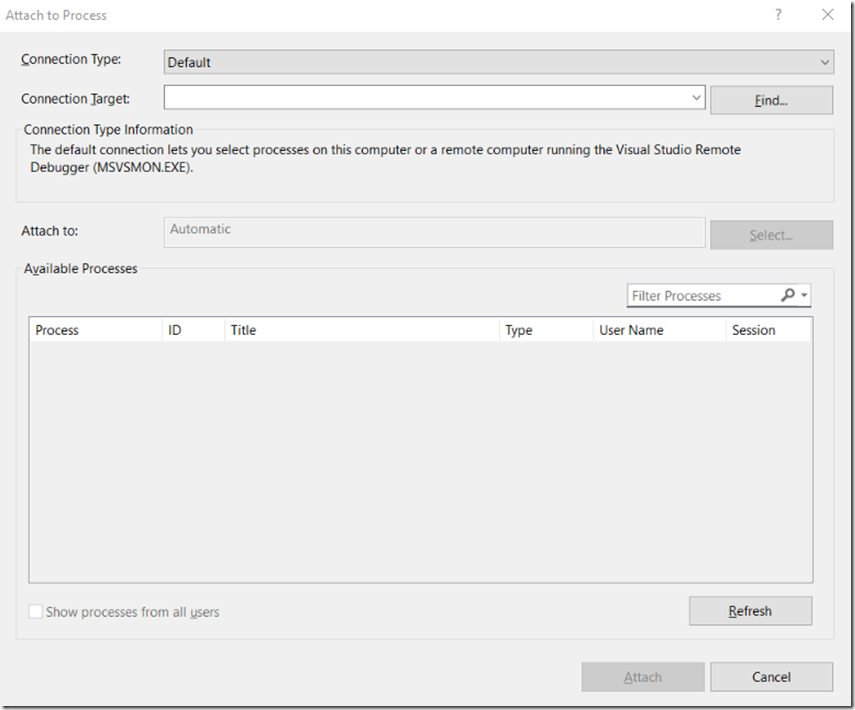
Instead of using Cloud Explorer how I showed in the 2016 article, let’s use the Attach to Process menu item found via the Debug menu, when you select the Attach to Process menu item a window, similar to that shown in Figure 1 is rendered.
Figure 1, remote debug an ASP.NET Core application on Azure
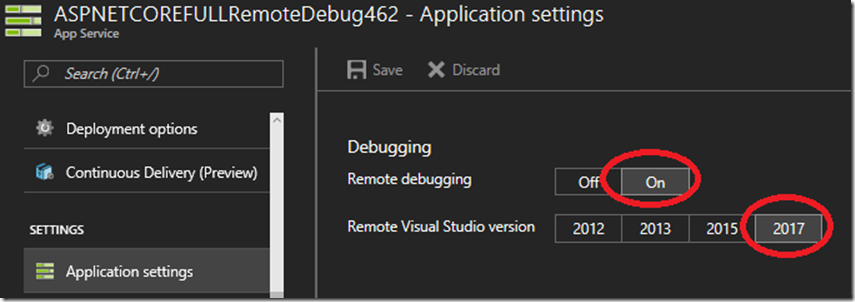
You need to confirm that you have enabled remote debugging for the App Service within the portal, similar to Figure 2. You find this option on the Application settings blade for the given App Service you wish to remote debug.
Figure 2, remote debug an ASP.NET Core application on Azure
Confirm the remote debugger is attached to the W3WP or ASP.NET Core process
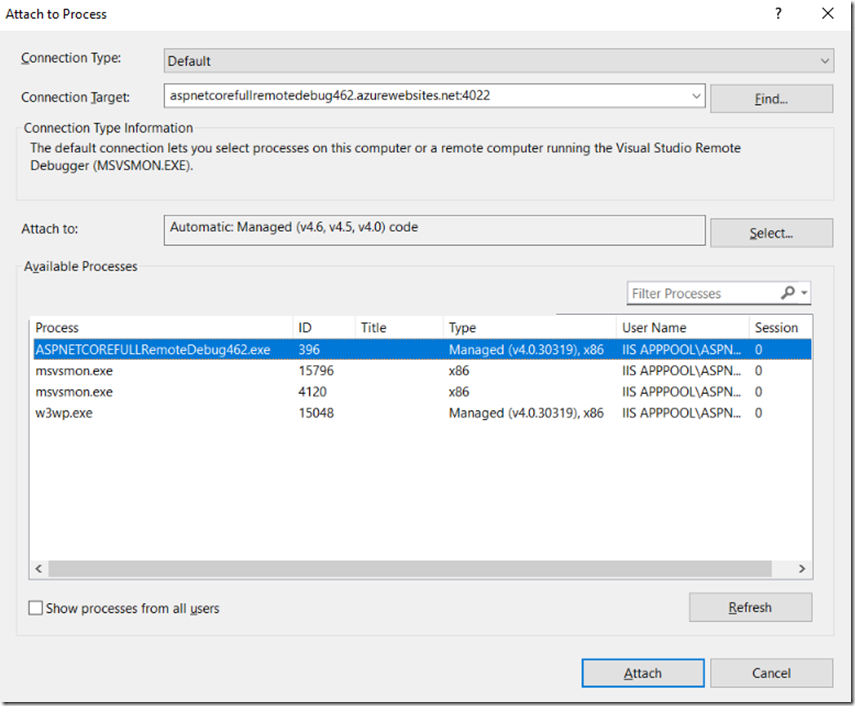
Enter in the URL of the Azure App Service you wish to remote debug into the Connection Target textbox shown previously in Figure 1 and press the enter key. If you are prompted to provide credentials, download your publishing profile, I show this in Figure 2 of this article and Figure 2 of this article. Once authentication is complete, you will see the a list of the processes, something similar to that shown in Figure 3.
Figure 3, remote debug an ASP.NET Core application on Azure
You can also look in KUDU/SCM which is discussed here and you will see the same list of processes, Figure 4.
Figure 4, remote debug an ASP.NET Core application on Azure
Set the break points
Initially I tried to get the debugger to stop in the Startup.cs and the Program.cs file, but those are run when the process is started, and a process needs to be running before you can connect the remote debugger. If you are trying to get into those methods, then you will need to find another way, for example, view streaming logs or profiling.
Also, when I set the break point I received the following notification, also shown in Figure 5.
The breakpoint will not currently be hit. No symbols have been loaded for this document
Figure 5, remote debug an ASP.NET Core application on Azure
I experienced that same when I configure remote debugging for a standard ASP.NET application you can read about that here. See section “Set the break point”.
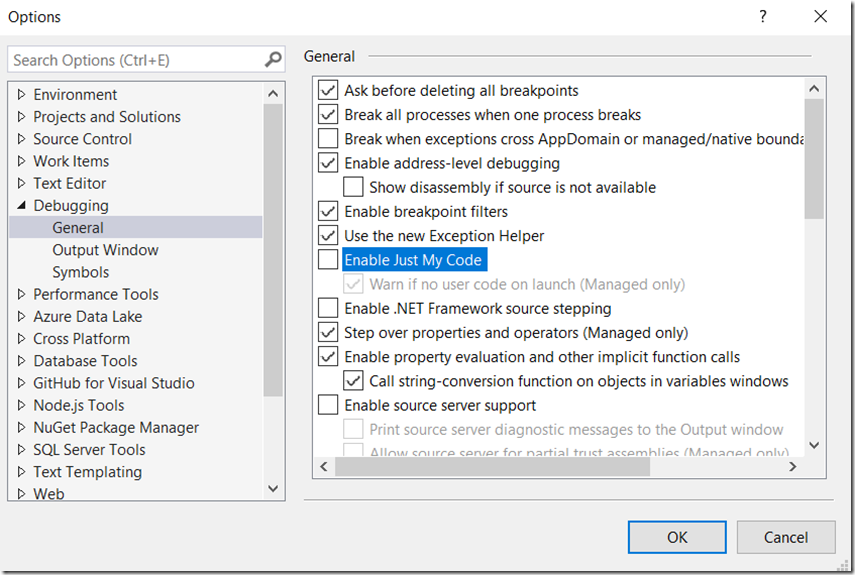
I resolved this disabling “Enable Just My Code” from the Tools –> Options menu in Visual Studio, as shown in Figure 6.
Figure 6, remote debug an ASP.NET Core application on Azure
Once the symbols are loaded you will notice that the message is gone. Now you can set the break points and step through the code.
Execute the process which is rendering the exception, performing slow or in an unexpected manner
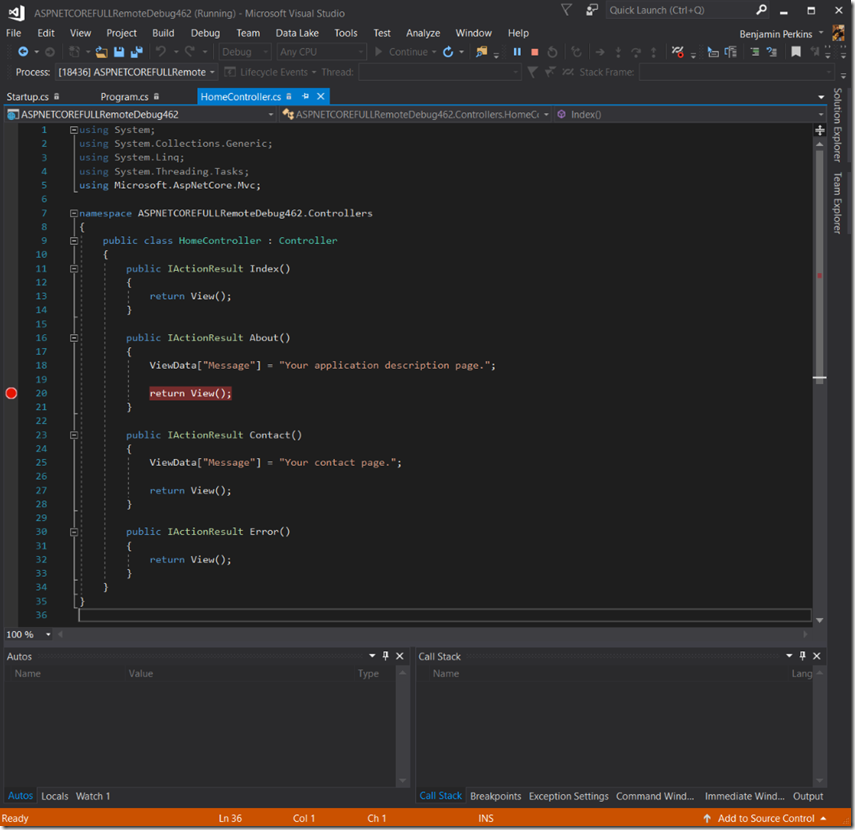
Set the break point as seen in Figure 7.
Figure 7, remote debug an ASP.NET Core application on Azure
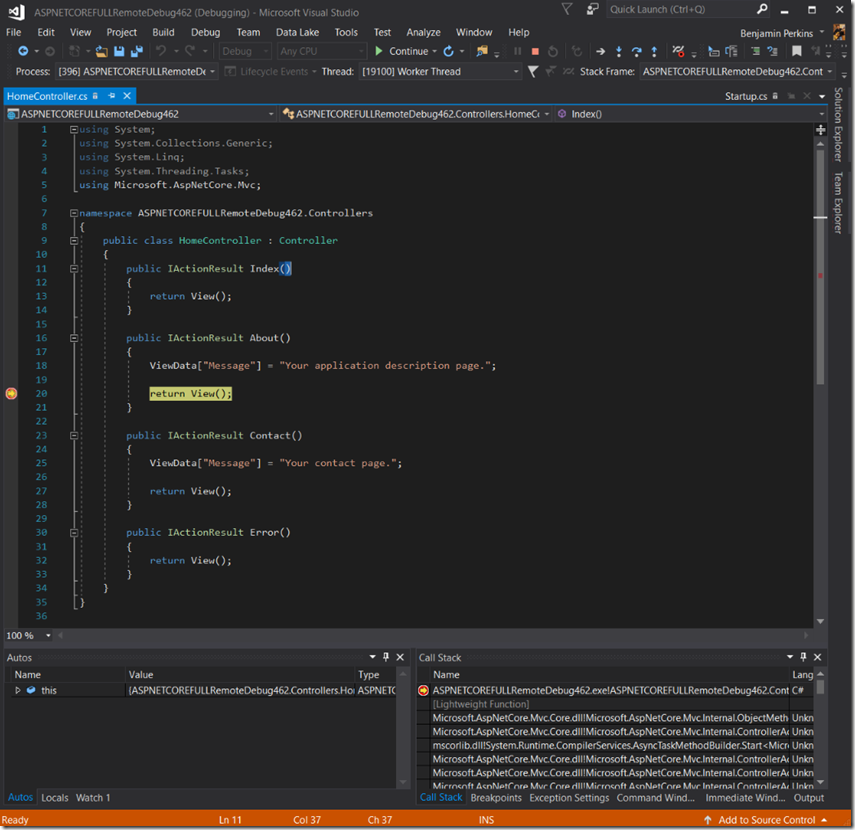
Finally, open the Azure App Service in a browser, navigate to the location where you expect to hit the break point and the execution will stop at the break point for further analysis, Figure 8.
Figure 7, remote debug an ASP.NET Core application on Azure
That’s it. Happy debugging
Debugging other technologies
IISNODE using Node inspector here.
PHP using display_errors here.
Notes about debugging
Have a look at the section “Notes about debugging” here.
- It is not recommended to run debug mode in production, because running in debug mode will prevent the web server from responding to other requests.
- Avoid long stops at breakpoints.
- Make sure debug=true, for ASP.NET, check out my other article about that here and here.
- After 48 hours, the remote debug feature is automatically turned off.
Comments
- Anonymous
July 12, 2017
Hi thanks for the postIt is trying to connect my azurewebsite server on 4022 and prompting for credentials. what credentials should i provide? i have tried FTP, azure subscription and windows. nothing works! can u throw some light?- Anonymous
October 20, 2017
bump- Anonymous
November 30, 2018
bump
- Anonymous
- Anonymous
- Anonymous
October 25, 2017
@Kalyan, have you tried your publish profile credentials? ALso, look at the comments at this blog. https://blogs.msdn.microsoft.com/benjaminperkins/2016/09/22/remote-debug-your-azure-app-service-web-app where I talk about "‘Send LM & NTLM – use NTLMv2 session security if negotiated". - Anonymous
July 22, 2018
The comment has been removed- Anonymous
July 25, 2018
In regards to MSDN blogs, these are not considered 'official' Microsoft documentation. Mostly these are my experiences and opinions. You might find this 'official' remote debug article better. I will review this article and check if I can improve it. Thanks for the feedback.
- Anonymous
- Anonymous
September 25, 2018
NOTE: ASP.NET Web Sites do not have symbols, ASP.NET Projects do. - Anonymous
November 30, 2018
Microsoft really needs to clean up the documentation around attaching debuggers. There's 3-4 different sets of credentials, and the debugger seems to be rejected with all of them. Yes, even the publish profile credentials (which are the same as the deployment credentials, but hey, why have one name for a thing when you can have two, right?).
