How to take a memory dump from a specific App Service instance
This article has been moved to its new home here: https://benperk.github.io/msdn/2016/2016-06-how-to-take-a-memory-dump-from-a-specific-app-service-instance.html
I wrote this article that discussed how to monitor the different instances of an Azure App Service. As you know, when you access the KUDU console, as I discussed here, you are accessing only 1 of the multiple instances, which may or may not be having a problem. So, if you take a memory dump as I discuss here from KUDU, then it might not render any benefits.
To create a memory dump on a specific instance, perform the following:
- Identify which instance is having the problem
- Create / Upload a PowerShell script that cycles through the instances
- Upload the PowerShell script
- Monitor to see when a dump is created
- Stop the continuous WebJob
Identify which instance is having the problem
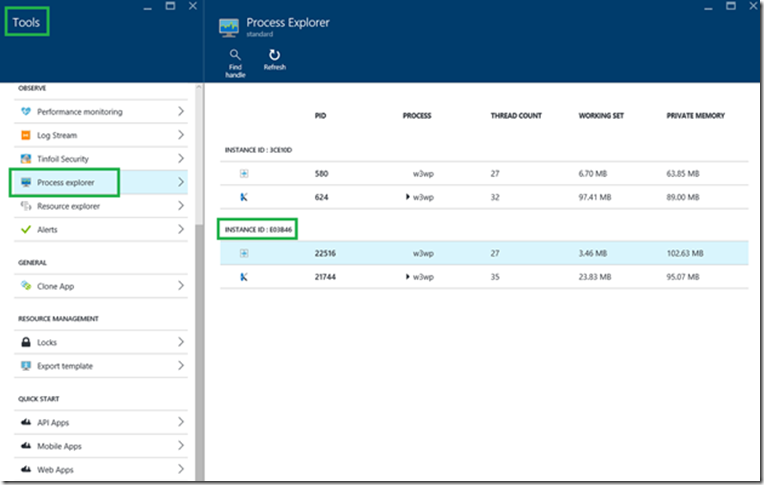
Click on the App Service Web App having the issue, then select Tools and then Process Explorer. Notice that each instance is uniquely identified by an instance ID as shown in Figure 1.
Figure 1, Azure App Service, Web App memory dump specific instance
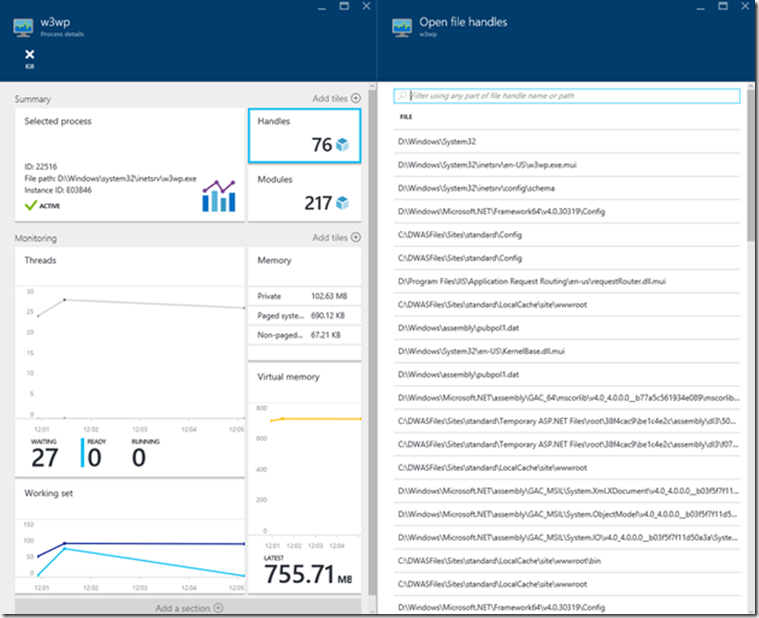
Click on each of the W3WP processes and view the process details, as shown in Figure 2. Nothing on the blade in Figure 2 jumps out, so you would probably move to the next W3WP process and see if there are any memory issues, handles count is very high, etc.…anything that looks very different than the other instances running your App Service Web App.
Figure 2, what is wrong with my Web App Azure, specific instance
Once you have found the instance where you want to capture the memory dump from, note down the instance ID, similar to that shown previously in Figure 1.
Create a PowerShell script and upload it to the App Service
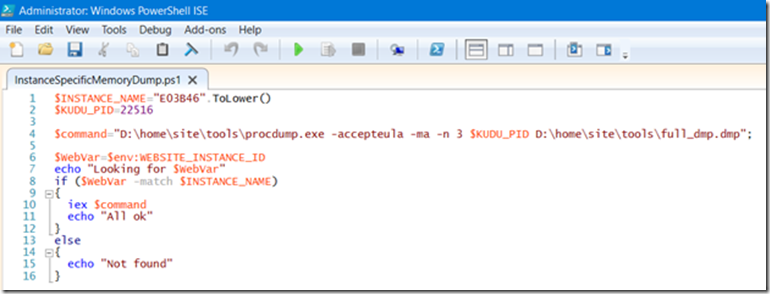
Using the Windows PowerShell IDE as shown in Figure 3, create the PowerShell script which will cycle through all the instances of the App Service Web App and, once found, take a memory dump of the given PID.
Figure 3, create a memory dump of specific App Service Web App instance
Here is the code, Script 1, so you can cut and paste it into a PS1 file. The $INSTANCE_NAME and $KUDU_PID are seen in Figure 1 previously.
Script 1, create a memory dump of a specific App Service Web App instance
$INSTANCE_NAME="E03B46".ToLower()
$KUDU_PID=22516
$command="D:\home\site\tools\procdump.exe -accepteula -ma -n 3 $KUDU_PID D:\home\site\tools\full_dmp.dmp";
$WebVar=$env:WEBSITE_INSTANCE_ID
echo "Looking for $WebVar"
if ($WebVar -match $INSTANCE_NAME)
{
iex $command
echo "All ok"
}
else
{
echo "Not found"
}
You can to place the PROCDUMP.EXE which is downloadable here, into the D:\home\site\tools directory. The important point is to place it into a directory within the D:\home directory so that it is accessible from all of the App Service Web App instances. Also, that it writes to a location accessible from all instances, so do not do either on the D:\local drive for example.
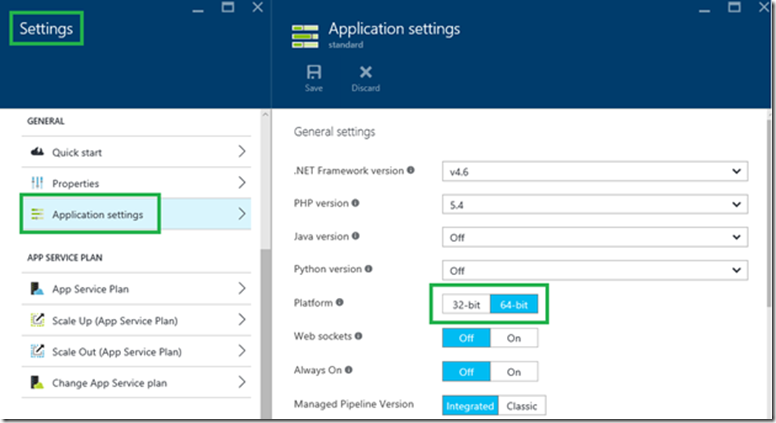
Using a tool like FileZilla the PRODUMP.EXE is deployed to the D:\home\site\tools directory. Be sure to confirm which platform you are running on, I.e. 32-bit or 64-bit, as shown in Figure 4.
Figure 4, use the correct Procdump bit version for App Service Web App specific dump
Therefore, as this site is running the 64-bit version of Windows Server, I need to run the 64-bit version of the Procdump component, procdump64.exe.
Also note that if the instance ID changes or the PID changes, you will need to update the PowerShell script. This can happen if one of the instances needs to auto heal or if you do not have Always On enabled.
Upload the PowerShell script
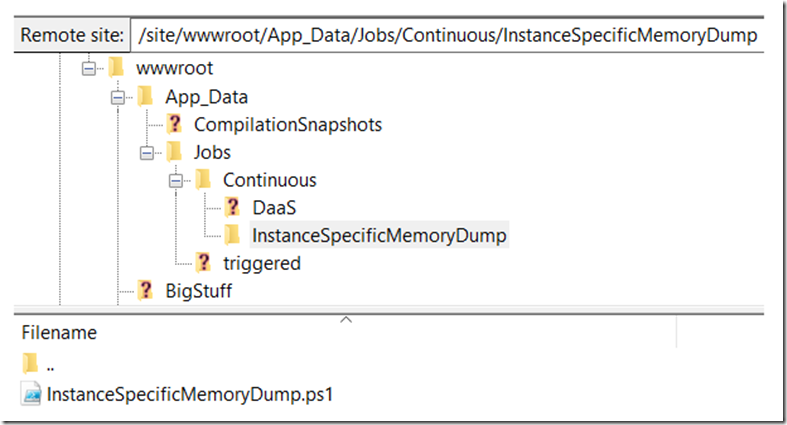
The trick to making this work is that the script runs as a continuous WebJob on all the instances. As described here, to make a WebJob run continuously it must be placed into the d:\home\site\wwwroot\app_data\jobs\continuous\{job name} directory. In this example the {job name} is InstanceSpecificMemoryDump, which is also the name of the .ps1 file placed within the directory. Again, use an FTP tool like FileZilla to create the path and deploy the script. There are numerous was to deploy, the point is that is must be in that directory location and it cannot be set as singleton. You should have a result similar to that shown in Figure 5.
Figure 5, placing the WebJob to capture memory dump specific App Service Website instance
Now that the script is deployed as a continuous WebJob, check the output to see that all is working and a dump is being created.
Monitor the WebJob
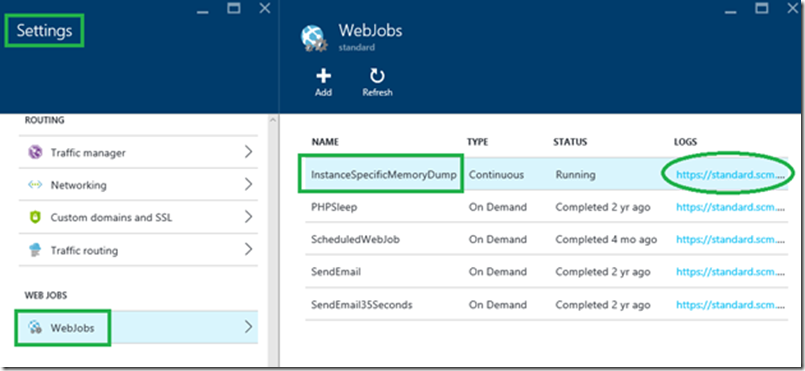
Open the WebJob blade within the Settings for the Azure App Service Web App, as shown in Figure 6.
Figure 6, check the status of your continuous WebJob
Notice also in Figure 6 that there is a link to the LOGS, click on that and you are redirected to the KUDU console where the output of the WebJob are written to a ~console, as shown in Figure 7.
Figure 7, monitor the WebJob that captures instance specific App Service Web App dump
Notice that the instance is found, the dump initiated and written to the location identified in the script. Now you can navigate to that directory, using for example FileZilla and download the memory dump for analysis.
I mentioned how you can analyze a memory dump here and here.
Stop the WebJob
Leaving this WebJob running will ultimately result in consuming all the available storage for your subscription plan. It could also have some impact on the recycling logic for the Web App, therefore, do not leave it running for long. Once you get the memory dump you need, simply remove the .ps1 file from the directory.
