Enabling Failed Request Logging on a Windows Azure Web Site
This article has been moved to its new home here: https://benperk.github.io/msdn/2013/2013-07-enabling-failed-request-logging-on-a-windows-azure-web-site.html
If you end up here please read this updated article here (Enable Failed Request Tracing for an Azure App Service Web App)
Using Failed Request Tracing is a very useful tool for troubleshooting performance issue on your Azure App Service, for example a Web App, and for any website running on IIS. Azure Web Apps do not currently support a remote desktop connection and therefore the configuration of the Failed Request Tracing feature is performed via the Azure Management console.
If you want to configure the IIS management console to remotely connect to your App Service, check out this article here.
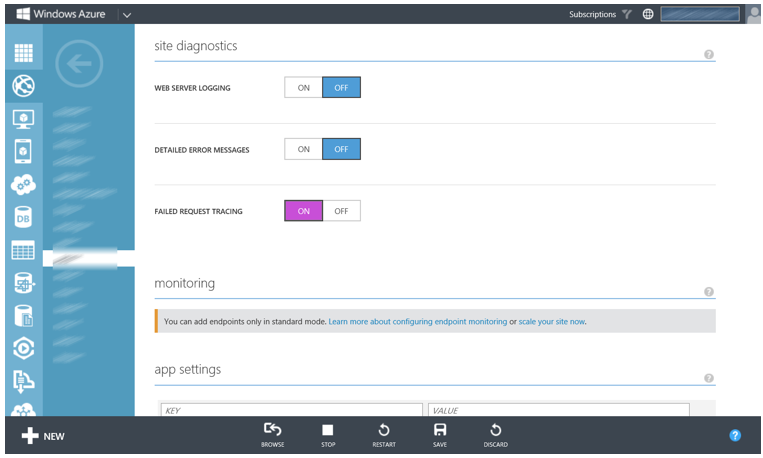
Once logged in to the Azure Management (AUX) console, navigate to the Web App where you are experiencing the slow response and select the CONFIGURE link. Scroll down until you find the Failed Request Tracing item within the Site Diagnostics section, Figure 1 illustrates this.
Figure 1, Enable Failed Request Tracing for an Azure Web App in the AUX portal
Turn the diagnostic on and select the Save item as illustrated on Figure 2a.
Figure 2a, Failed Request Tracing in Azure Web App in the AUX portal
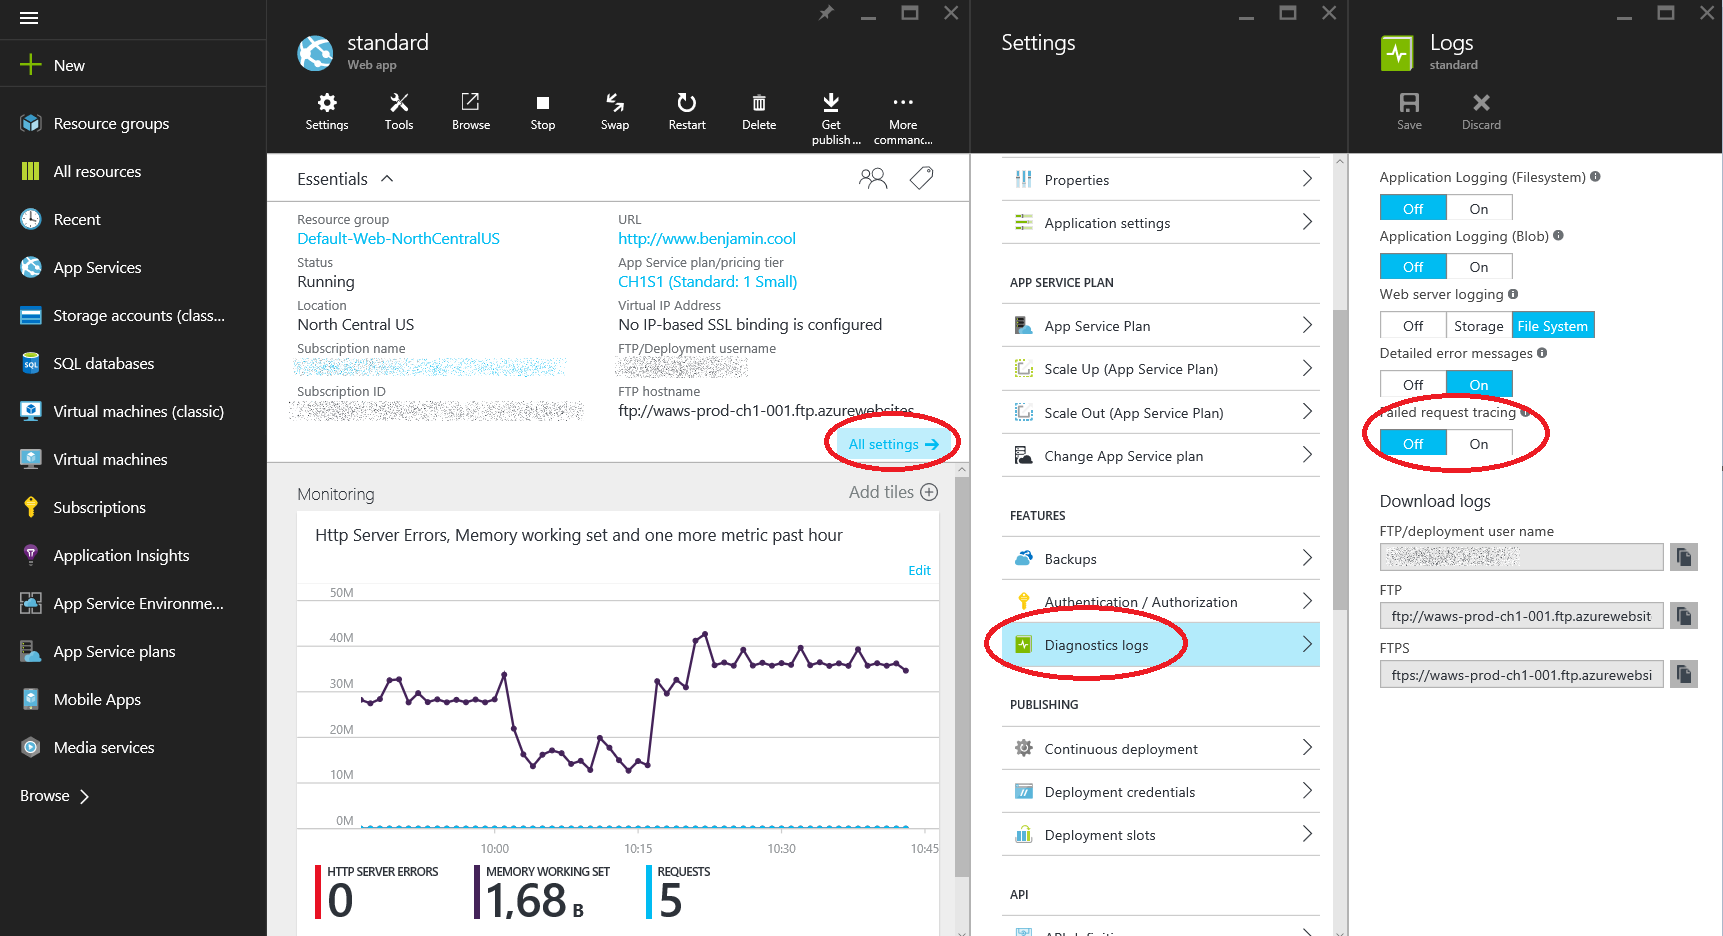
To perform the same in the new portal, select the Web App, API App, Mobile App or Logic App -> All Settings -> Diagnostic Logs to enable Failed request tracing, as shown in Figure 2b.
Figure 2b, Failed Request Tracing for an Azure App Service, ex: Web App, API App, Mobile App or Logic App
Once enabled, requests to your Web App will begin to be logged. By default, requests with an HTTP Status of 400-999 only, are logged. That means if you are getting an error of some kind, all you need to do is enable Failed Request logging from within the management console, download and review.
On the other hand, if you are experiencing slow responses where the HTTP Status is a 200, no Failed Request Tracing log will be generated as the result would not match the default rule parameters. To modify the Failed Request Tracing rule, you need to add something similar to the following code snippet within the <system.webServer> tag, to your web sites' web.config file.
<tracing>
<traceFailedRequests>
<remove path="*" />
<add path="*">
<traceAreas>
<add provider="ASP" verbosity="Verbose" />
<add provider="ASPNET" areas="Infrastructure,Module,Page,AppServices" verbosity="Verbose" />
<add provider="ISAPI Extension" verbosity="Verbose" />
<add provider="WWW Server" areas="Authentication,Security,Filter,StaticFile,CGI,Compression,
Cache,RequestNotifications,Module,FastCGI"
verbosity="Verbose" />
</traceAreas>
<failureDefinitions timeTaken="00:00:05" statusCodes="400-599" />
</add>
</traceFailedRequests>
</tracing>
NOTE: the values set in the failureDefinitions uses OR and not AND, so the above rule will capture traces if the request takes longer than 5 seconds OR if the request HTTP status is between 400 and 599.
Enabling FTP and Downloading the Failed Request Trace logs
To configure FTP capabilities for your Azure App Service, look at the features available on the DASHBOARD link for the given App Service. A nice blog on how to set this up FTP and download the log files can be found here and here.
The log files, when created, are stored in the /LogFiles/W3SVC* directory, an example of this using FileZilla FTP client, is shown in Figure 3.
Figure 3, Failed Request Tracing logs storage location
Once downloaded, open the files in Internet Explorer and analyze them.
Also, in the new Azure portal, you can click on the Troubleshoot link and view the logs in KUDU, as seen in Figure 4.
Figure 4, View Failed Request Tracing logs in KUDU once enabled


