Create a memory dump of your App Service when it consumes too much memory
This articles has been moved to its new home here: https://github.com/benperk/benperk.github.io/blob/master/msdn/2016/2016-10-create-a-memory-dump-of-your-app-service-when-it-consumes-too-much-memory.md
I have written a number of troubleshooting labs here, one of which is Lab 21: WinDbg – Memory Consumption. In this article I will identify how to capture a memory dump of a process that is consuming too much memory. In this case it is running on an Azure App Service Web App.
NOTE: This is an advanced topic and capturing a memory dump without planning and understanding the impact can result in bringing your web site down for some time, please proceed with caution, I have noted things to watch out for as you get to them.
The actions to create a memory dump of the W3WP process running on an App Service Web App are:
- Select the Mitigate link then Go
- Configure the rule
- Download the memory dump
- View the analysis report
Select the Mitigate link then Go
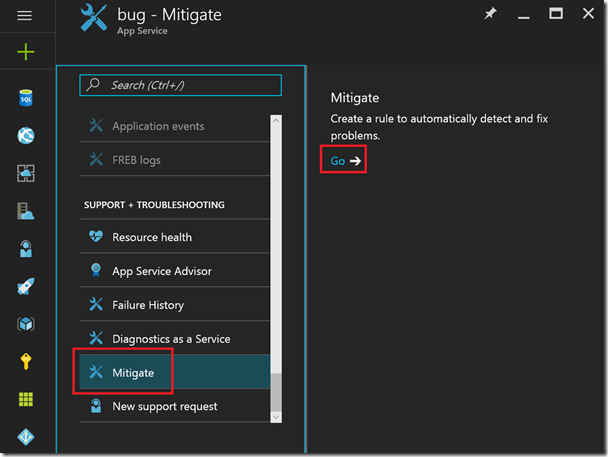
Access the Azure portal and navigate to the Web App having the memory consumption issue. Then click on the Mitigate link and then Go-> as shown in Figure 1.
Figure 1, capture a memory dump, Web App, App Service, memory consumption
Clicking on the Go-> link will open a new tab where you have the ability to configure a rule for memory dump collection.
Configure the rule
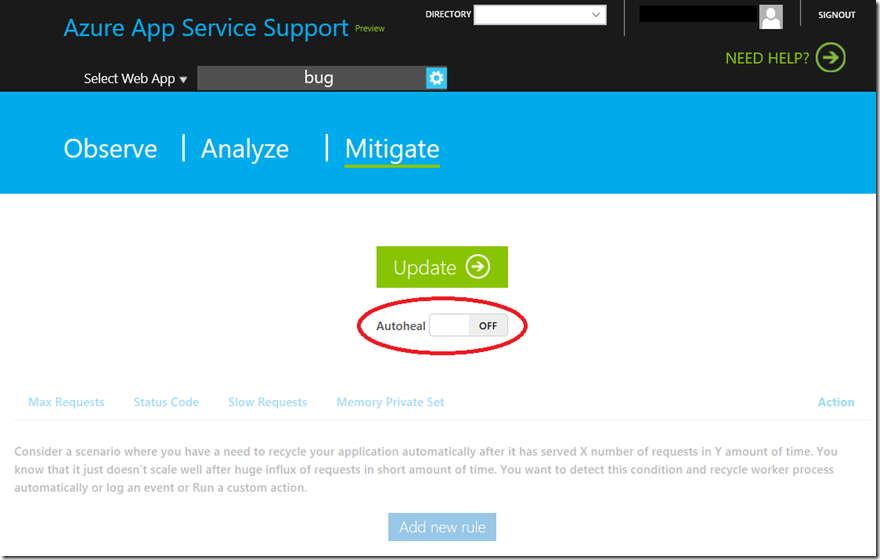
After clicking Go-> a page like the one shown, Figure 2, is rendered. Click the Autoheal button to turn it on.
Figure 2, enable auto heal Azure, memory problem
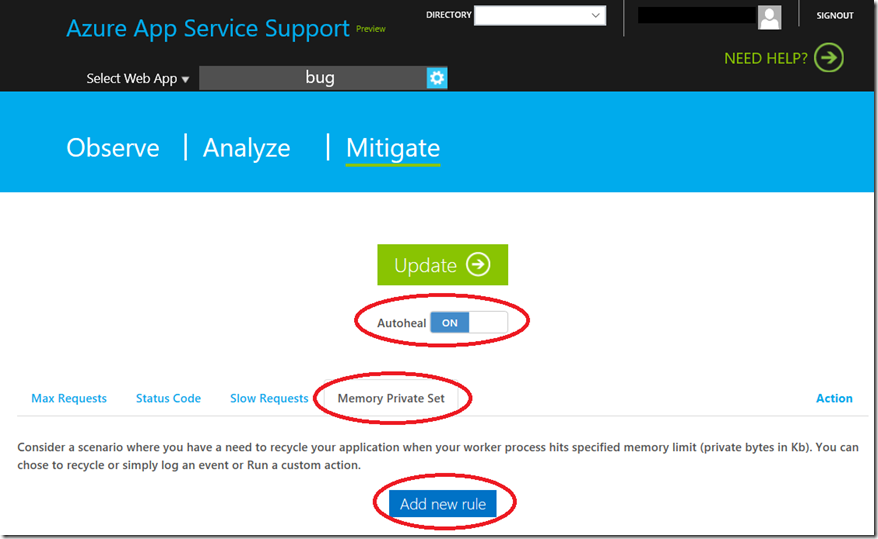
Next, select the Memory Private Set and click the Add new rule button as shown in Figure 3.
Figure 3, configure rule for memory consumption capture dump
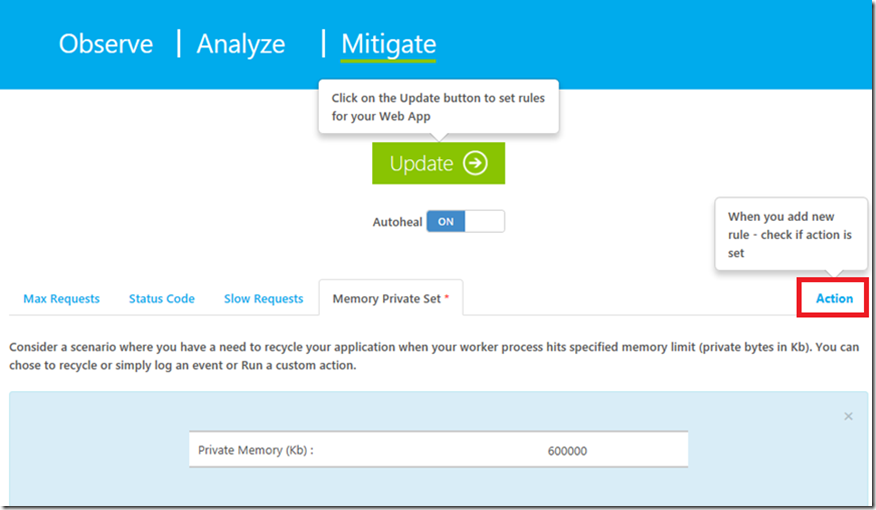
Clicking on the Add new rule button will result in the window illustrated by Figure 4 opening. Here you will enter the amount of memory in KBs, that when the process hits that value, an memory dump is then taken.
Figure 4, set the private byte limit for memory dump collection
I recommend that you set the value low because you will need memory to execute the rule, capture and possibly analyze the memory dump. Do not set the limit at the maximum limit on your service plan, because you would not have any left to capture and process the dump file.
For example, if you are running a SMALL and have 1.75GB of memory, there are other services that need memory as well to run a web site and the Operating System. Therefore, if you are running a SMALL, the maximum memory threshold for a SMALL would be 500-750MB and that is pushing the high limit already. Consider that if you have a memory consumption issue, then scale up to a size with more memory during the troubleshooting process, then once you find it and fix it, you can scale back down. For this example my setting is 600MB which is ~40% of the total available for a SMALL instance.
When I set this up originally, I got the value all wrong and it was set to 6MB instead of 600MB, I also set it a 600GB once, so make sure to perform the calculation correctly, as a mistake can cause disruption on your site. 600MB is 600,000KB, 6MB is 6,000KB, 60MB is 60,000KB and 1.75GB is 1,750,000KB. Use an online calculator so you are sure to get it correct the first time.
NOTE that the available memory on the VM is used for running the operating system, telemetry and auto-healing services, so you need to have enough for this process to work, otherwise you might get a crash or locking.
Once you click the Add button as shown in Figure 4, a page similar to Figure 5 is rendered. Click on the Action link.
Figure 5, set an action to capture a process consuming too much memory
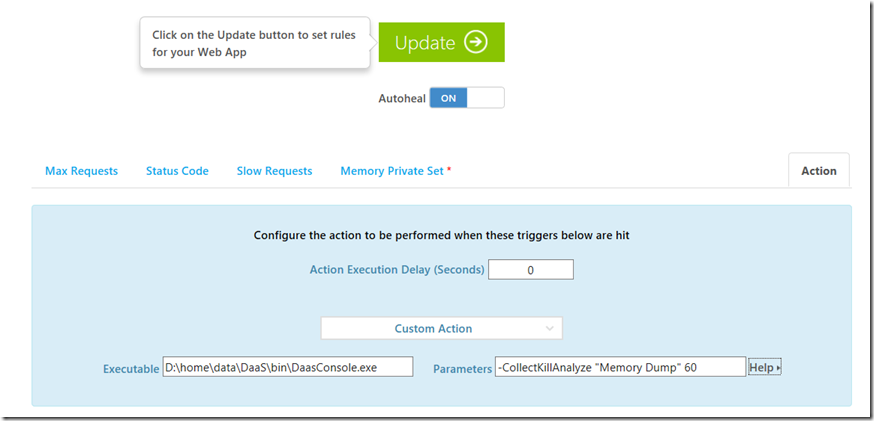
Selecting the Action link renders a page similar to that shown in Figure 6. Before I accepted it, I wanted to find out a few things about the settings, for example, what the Action Execution Delay (Seconds) meant. Additionally, I wanted to know what the executable with those parameters specifically would do.
Figure 6, set the custom action for memory dump, memory consumption, too much memory
The Action Execution Delay (Seconds) means that if my rule is hit, wait those many seconds before taking the action. To find the details about the executable and its parameters, I clicked on the Help link and found some great information.
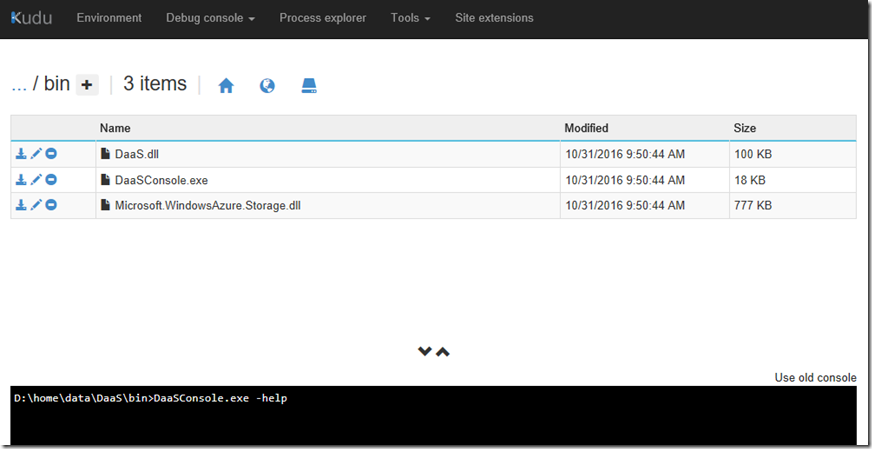
I also accessed the KUDU console, which I describe here, and executed a DaaSConsole –help command which dumped out the same information as the content described at the Help link, as shown in Figure 7.
Figure 7, run the DaaS from KUDU
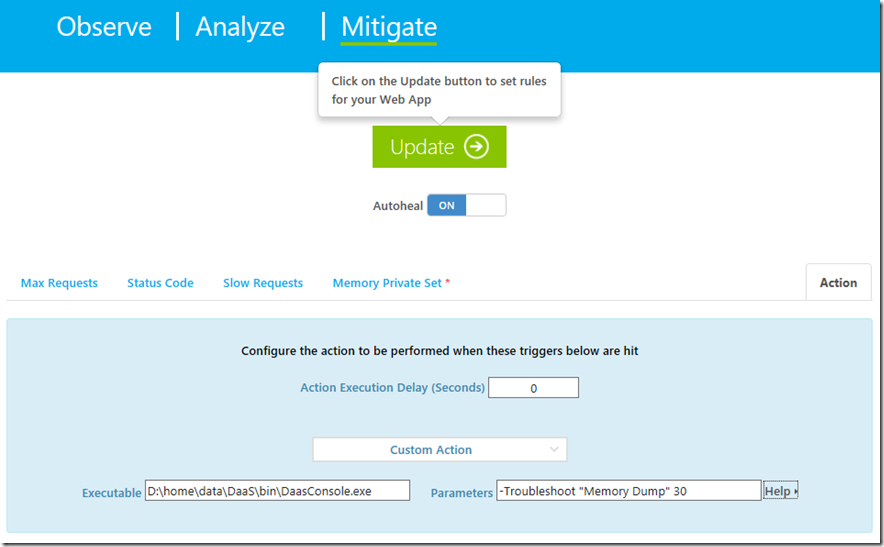
After reviewing the details, I decided that I did not want to kill the main site W3WP process, so I changed the –CollectKillAnalyze to –Troubleshoot, you could also use the –CollectLogs parameter if you plan on downloading the memory dumps and analyzing them yourself. The difference between the –Troubleshoot and –CollectLogs parameters is that the –Troubleshoot parameter will do some analysis on the memory dumps. NOTE: the collection and analysis procedure uses the same CPU and memory available for your web app, if you are running a SMALL, you may get some issues if you ultimately use all the CPU and Memory for this data capturing.
I also wanted to learn more about the “Diagnoser” parameters so I dumped them using the DaaSConsole –ListDiagnosers command. Indeed, in this case I wanted a ‘Memory Dump’ so this is what I needed.
The 60 needed a little investigation, but found that quickly to be the TimeSpanToRunForInSeconds, I saw the default was 60 seconds, I changed it to 30, as seen in Figure 8. What this means is … I think is that it will capture a memory dump every 30 seconds while the issue is happening. When I this rule was triggered I did see more than 1 memory dump captured with about 30-60 seconds between them. Could be my 30 second window is too short and the capturing of the second dump within the 30 seconds only started after the first one completed. Nonetheless, when you capture the dump disable the rule. NOTE: once the data is captured, disable the rule.
Figure 8, a more custom, custom action, collect memory consumption Web App, Azure
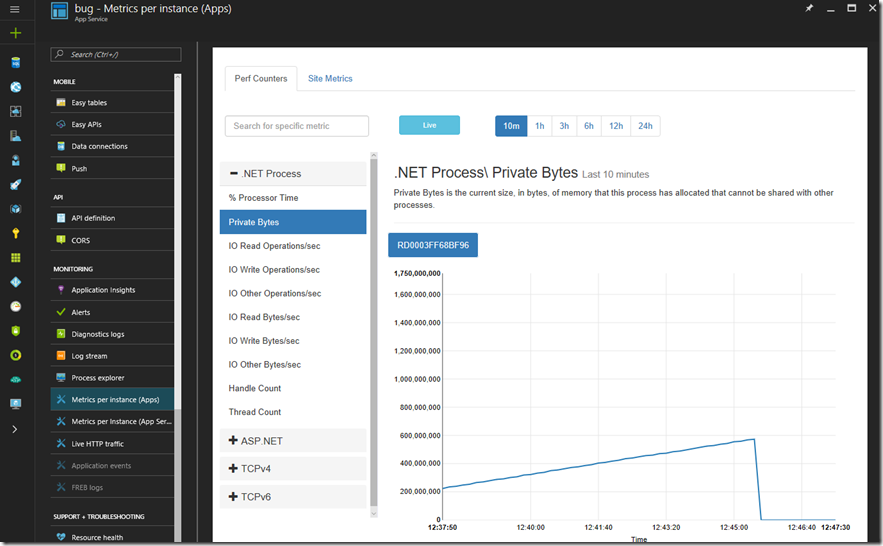
Once you rule is set, click the Update button as seen in Figure 8 and wait for the consumption issue to happen. I watched it happen live in the Azure portal by navigating to the Web App and clicking on the Metrics per instance (App) link. As seen in Figure 9a, the memory increases slowly up to the threshold, I was not able to tell if the rule actually did restart the process or if the test I was running to consume the memory stopped at just at that time. Figure 9b is a report from a 3 hour period.
Figure 9a, memory consumption W3WP, Web App, App Services, Azure in real time 
Figure 9b, memory consumption W3WP, Web App, App Services, Azure over 3 hours
Either way, the memory dump was taken at the point I needed it, now the rule is disabled, so lets download the memory dump and look at the report.
Download the memory dump
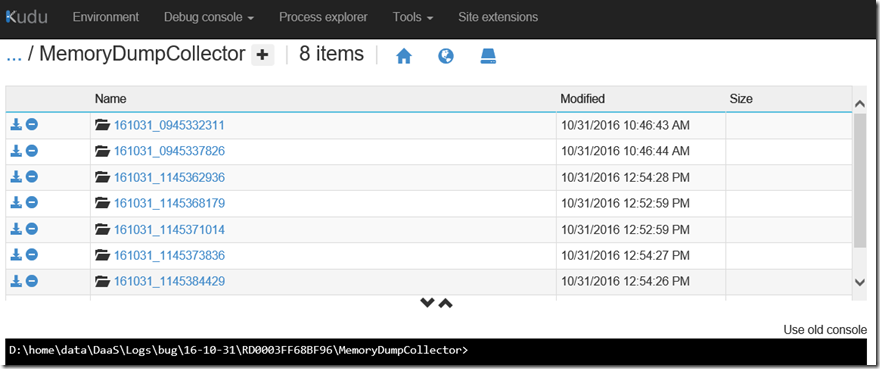
Memory dumps are written to the d:\home\data\Data\Logs\bug\… similar to that shown in Figure 10.
Figure 10, where are memory dumps stored on Azure, App Service Web App
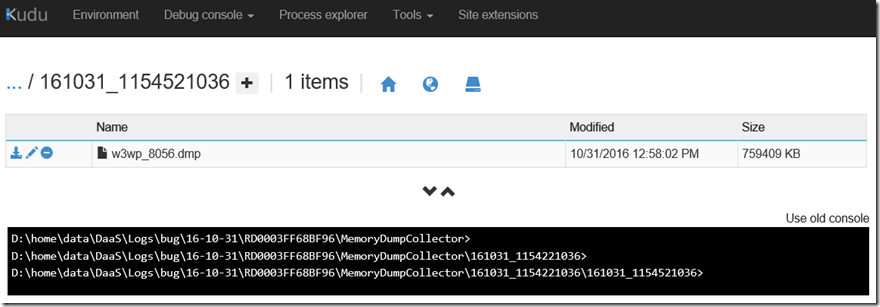
Then navigate to the one you want, you would probably want to get them all. Perhaps use an FTP utility if it is easier.
Figure 11, download the memory dump
Analyze the memory dumps using the debug diagnostics tool as discussed here or walk through the IIS lab here.
View the analysis report
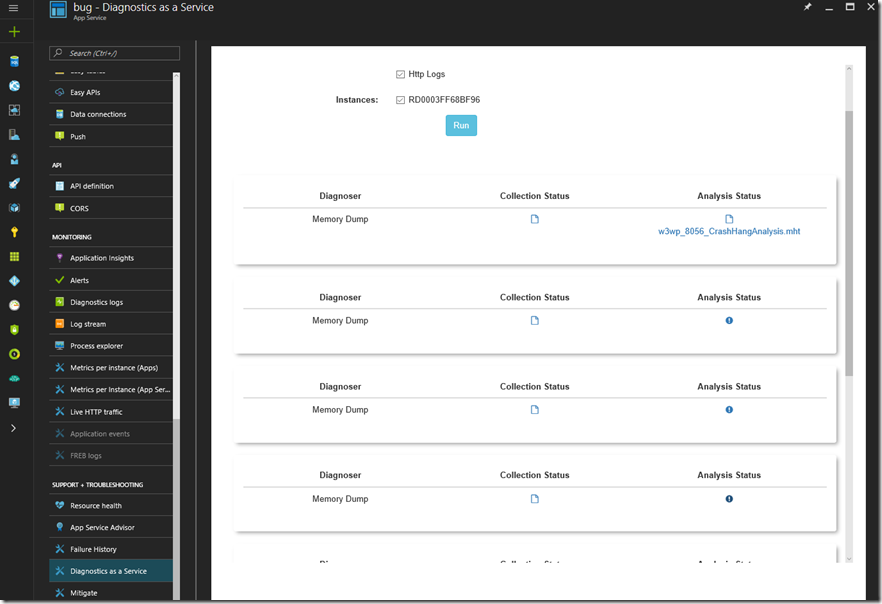
You can also download the memory dump and view the analysis report from within the Azure portal. As shown in Figure 12, navigate to the Web App where the dumps were taken and click on the Diagnostics as a Service link. Then click on the Analysis Status to view the report or the Collection Status to download the memory dump.
Figure 12, viewing the analysis report of the memory consumption web app
I wrote this post that discusses how to get the correct SOS.DLL for the Web App which is useful for analyzing the dump in WinDbg, you might want to get that one and MEX, as I wrote about here. However, the best bet is to either open a support case or work through these labs, specifically Lab 21: WinDbg – Memory Consumption here, once completed. Note to self –> do that soon…
