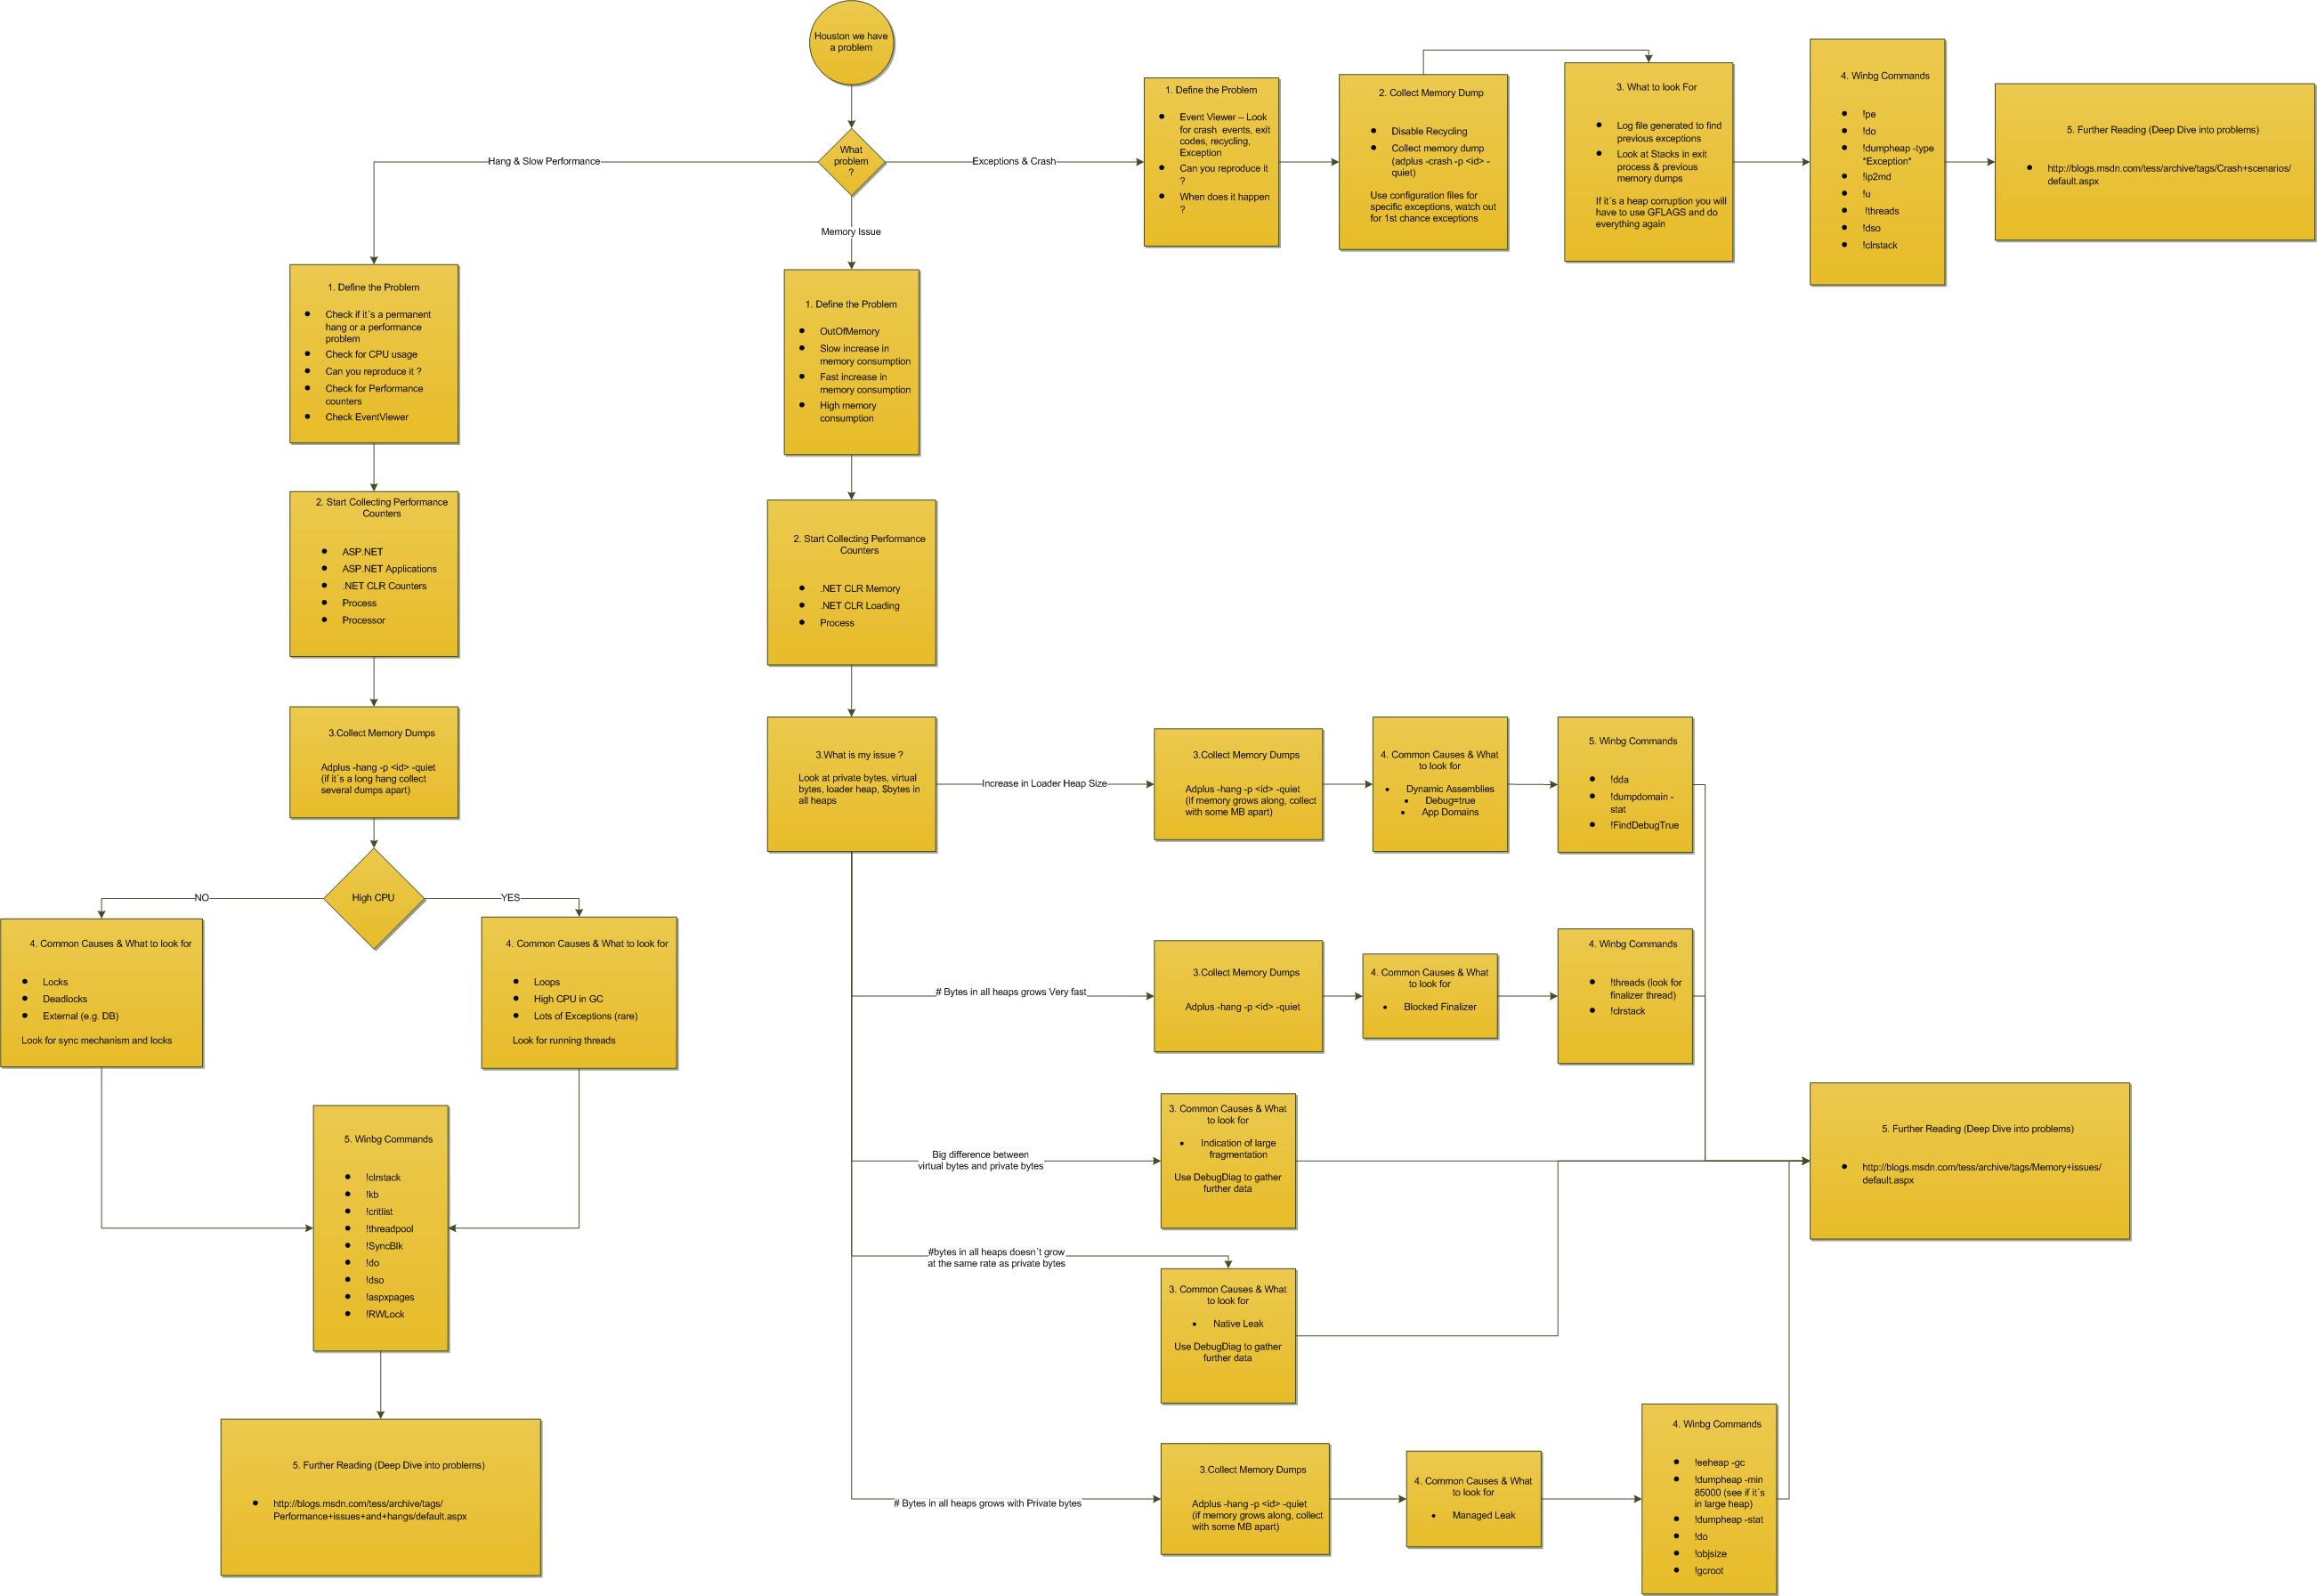
Production Troubleshooting Flowchart
Usually (probably always I hope) when troubleshooting production environments we don´t have Visual Studio or other “nice looking” tools to help us finding problems. But we have one of my favorite tools: Windbg.
The first time someone showed me Windbg and all the stuff around production debugging like memory dump, … I was a little (maybe not just a little) scared on this new world that had just opened in front of me. So my next question was: where do I start from? And probably like almost everyone that starts exploring this “new world” there are excellent blogs like https://blogs.msdn.com/tess (If Broken it is, fix it you should), https://blogs.msdn.com/dougste (Notes from a dark corner), https://blogs.msdn.com/tom (ASP.NET Debugging) and many others.
One of my biggest problems at first was to understand (and remember) what and when I should collect information that could help me to troubleshoot the issue. The blogs above have a lot of information about taking the first steps. To simplify this task I´ve created a little graphical memo that would help me. Now don´t take this flowchart as the “holy grail” but I believe it can help (at least until you get the basics in your mind).

Right click on the image to save it and it will be more “readable”.
Have fun
Bruno