Debug Dynamics 365 for Finance and Operations on-premises with Visual Studio remote debugger
In this article I’m going to explain how to use Visual Studio Remote Debugger to debug a Dynamics 365 for Finance and Operations AOS in an on-premises environment. Why would you want to do that? Well, if you have an issue occurring in an on-premises environment that you can't reproduce on your developer (also known as Tier1/onebox/dev box) environment, this allows you to attach Visual Studio from the developer environment to the on-premises AOS and debug X++ code.
There's another related article on here, to debug an on-premises AOS without Visual Studio, which may be useful depending on your circumstances.
Overview
The basic gist of this process is:
1. Use a D365 developer environment which is on the domain (and of course the network) with the AOS machine
2. Copy the remote debugging tools from developer environment to the AOS
3. Run the remote debugger on the AOS
4. Open Visual Studio on the developer environment and attach to the remote debugger on the AOS
5. From this point debug as normal
First let’s talk about why I’m using a developer environment which is joined to the domain: The remote debugger has a couple of authentication options – you can either set it to allow debugging from anyone (basically no authentication), or to use Windows authentication. It’s a bit naughty to use the no authentication option, although the remote debugger wouldn’t be accessible from the internet, it’s still allowing that access to the machine from the network without any control on it. So we’ll use the Windows authentication option, which means we need to be on the domain.
There’s nothing special about adding a developer environment to the domain, join as you would any other machine - I won't go into that here.
Copy the remote debugger to the AOS
On the developer environment you'll find "Remote Debugger folder" on the Windows start menu:
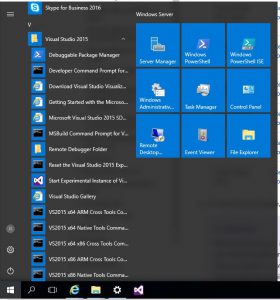
Copy the x64 folder from there, and paste it onto the AOS you're going to debug. Note that if you have multiple AOS in your on-premises environment, turn off all but one of them - so that all requests will go to that one AOS that you're debugging. Within the folder double click msvsmon.exe:
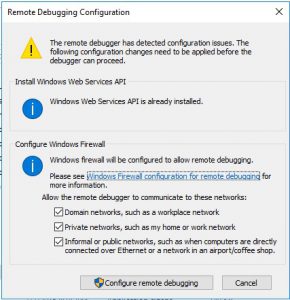
The remote debugger will open, and look something like this, take note of the machine name and port, in my case it's SQLAOSF1AOS1:4020.

Configure the developer environment
Now move over to the developer environment, log on as an account which is an Administrator of both the developer machine and the AOS machine you want to debug. Open Visual Studio and go to Tools, Options, set the following options:
Dynamics 365, Debugging: Uncheck "Load symbols only for items in the solution"
Debugging, General: Uncheck "just my code"
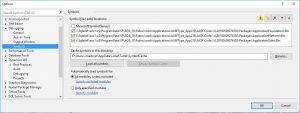
Debugging, Symbols: add paths for all packages you want to debug, pointing to the location of the symbols files on the AOS you want to debug, because my account is an Administrator on the AOS box I can use the default C$ share to add those paths, like this:
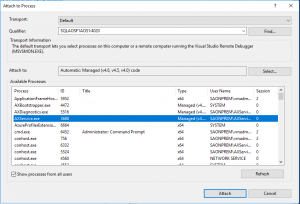
Close the options form, and then go to Debug, Attach to process.., in the window that appears set the qualifier to the machine and port we saw earlier in the remote debugger on the AOS machine, in my case it was SQLAOSF1AOS1:4020. Then at the bottom click "Show processes from all users" and select the AXService.exe process, this is the AOS.
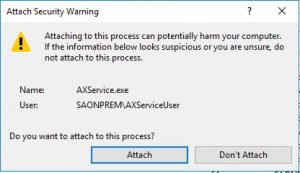
You'll get a warning, click attach.
On the AOS machine, you'll see in the remote debugger that you've connected:

Now open some code and set a breakpoint, in my case I'm choosing Form\CustTable.init(), then open the application in the browser and open the form to hit your breakpoint.

Switching between source code files
When you try to step into a different source file, for example if I want to step from CustTable.init() down into TaxWithholdParameters_IN::find(), then I need to open the code for TaxWithholdParameters_IN manually from the Application explorer (AOT) before I step into it, if you don't do that you'll get a pop up window asking you where the source code file is - if that happens, then you can just cancel the dialog asking for the source file, go open it from the AOT, and then double click on the current row in the call stack to force it to realize you've got the source file now.
Happy debugging!
