Creating a custom performance monitor counter for SQL Server
If you have ever needed to monitor a value in SQL Server, or follow the trend of anything that can be expressed in a numerical value – then creating a custom performance monitor counter could be just what you need….
For this example, I am going to use a query that calculates the size of the USERSTORE_TOKENPERM cache in SQL Server. This was an issue in SQL Server 2005 before SP3. The details of this are outlined in the following kb article:
FIX: A gradual increase in memory consumption for the USERSTORE_TOKENPERM cache store occurs in SQL Server 2005
https://support.microsoft.com/kb/933564
This issue has now been resolved, but it provides a perfect use and example of using a custom performance counter.
The query for finding the size of this cache is taken from the kb article and is below:
select sum(single_pages_kb+multi_pages_kb) 'total memory for tokeperm' from sys.dm_os_memory_clerks where type = 'USERSTORE_TOKENPERM'
We take the value returned by this query and store it in a variable as below:
declare @cache_size int;
set @cache_size = (select sum(single_pages_kb+multi_pages_kb) from sys.dm_os_memory_clerks where type = 'USERSTORE_TOKENPERM')
Now that we have the size of the cache, we use the first of 10 special stored procedures called sp_user_counter1 for our first counter. There are 10 sequentially numbered/named stored procedures up through sp_user_counter10 to allow you to have 10 unique custom performance monitor counters. Now, to update our counter, we simply call the stored procedure with our value:
declare @cache_size int;
set @cache_size = (select sum (single_pages_kb+multi_pages_kb)from sys.dm_os_memory_clerks where type = 'USERSTORE_TOKENPERM')
exec sp_user_counter1 @cache_size;
Then we can execute this piece of code every few minutes inside a SQLAgent job to continually update our new counter.
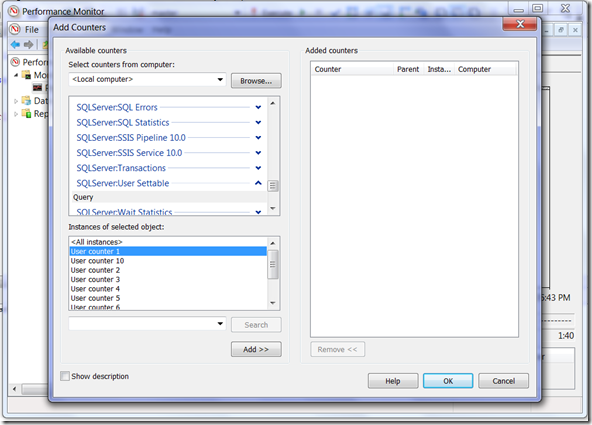
Next, we need to find the User Settable object and our counter in Performance Monitor:
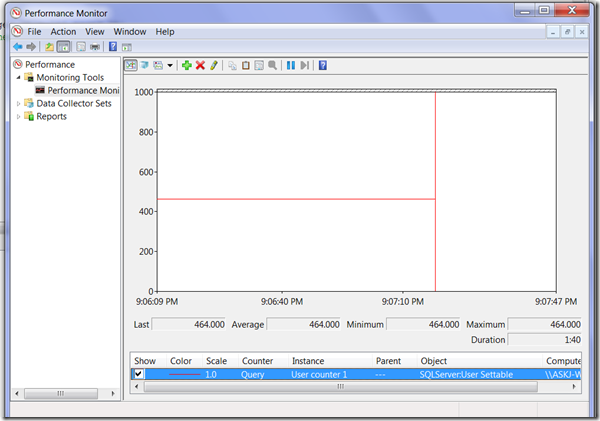
Then, add that counter and we see our graph… The size of my cache is not changing here, so the line remains flat…
To show the graph reflects our value, we’ll 1/2 the value manually to see the line drop by adding the following to our TSQL code just before updating the counter:
set @cache_size = @cache_size / 2;
And now our graph is reduced by 1/2 as expected:
There are many possibilities for this cool, but little-known feature in SQL Server. However, use caution when executing queries that update this value – don’t create a large memory or I/O intensive queries that will degrade server performance every time it runs.
More information on the User Settable object and counters is available here:
https://msdn.microsoft.com/en-us/library/ms187480(SQL.90).aspx
-Jay
Comments
- Anonymous
February 18, 2010
The comment has been removed - Anonymous
February 20, 2010
Great stuff, Jay. Thanks for posting this. - Anonymous
December 29, 2011
Thanks. This helped me create a procedure that posts run times of a SQLAgent job to a perfmon counter.-Vinayhttp://vinayvenu.blogspot.com/


