Using Trace-Points in Visual Studio
Even though everyone knows about break-points, trace points seem to have been used way less.
Developers sometimes need to inspect variables and other state as a program flows without interrupting the execution (so no break points). Even if the program is built with detailed tracing (as outlined here) a lot of things are missed in them (how many local variables are traced?).
So most developers quickly add a Console.WriteLine or Debug.Trace.Write to dump the information. Now this requires changing code (checkout), not able to remember all the changes and so forth.
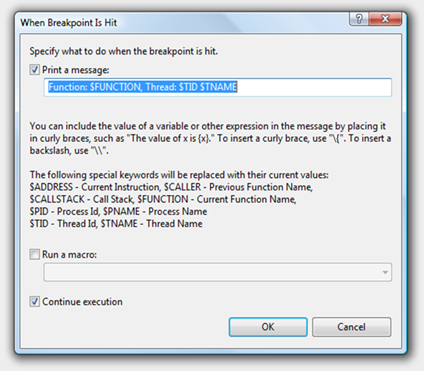
Visual studio supports this scenario very well. Just add a break point to the line where you want to trace and then right click on the break point icon and choose "When Hit" in the context menu. The dialog shown below opens up and you can choose to trace anything you want using the Print Message checkbox including function, thread, variables, messages. The messages are dumped to the output window when you debug the application. It's easy to manage these as well as they come up in the BreakPoints window (Debug->Windows->Breakpoints).
Comments
- Anonymous
June 24, 2008
The comment has been removed - Anonymous
October 25, 2009
The comment has been removed
