Trend scores for Viva Glint Employee Lifecycle programs
Microsoft Viva Glint recurring surveys happen at definite points in time and trend based on each survey launch. But scores for Viva Glint Employee Lifecycle (ELC) surveys trend differently because of their ongoing nature.
- ELC surveys, by default, display scores filtered to surveys delivered in the last 90 days.
- ELC surveys are always active so reports group based on the date range selected and not a specific survey date, like with recurring surveys.
- ELC results appear in dashboards in real time and follow program confidentiality thresholds for displaying results to users who have access.
Note
For the Executive Summary Report in Employee Lifecycle programs: If program settings allow users to submit multiple surveys for an ELC survey, they may have multiple response records in raw survey response exports. However, aggregated reports in the platform count them only once.
Date filters for Lifecycle reports
Users have access to multiple preset date range filters and can apply custom date ranges in ELC survey reports. Keep in mind that:
- ELC survey reports use survey delivery date as the date type for filtering in reports.
- Dates are based on calendar year (not fiscal year) in ELC survey reports.
Default date range
Reports for ELC surveys default to a view of results for surveys delivered in the past 90 days. The date displayed when you hover over data points is the first day of that range - meaning that the most recent data point is 90 days before today's date and previous data points in trend lines display data with ranges whose start dates are 90-day increments in the past. For more information, see the following table.
| Data point | "Surveyed on" date displayed | Score date range |
|---|---|---|
| Most recent | 90 days before today's date | 90 days before today - today |
| Second most recent | 180 days before today's date | 180 days before today - 90 days before today |
| Third most recent | 270 days before today's date | 270 days before today - 180 days before today |
| Fourth most recent | 360 days before today's date | 360 days before today - 270 days before today |
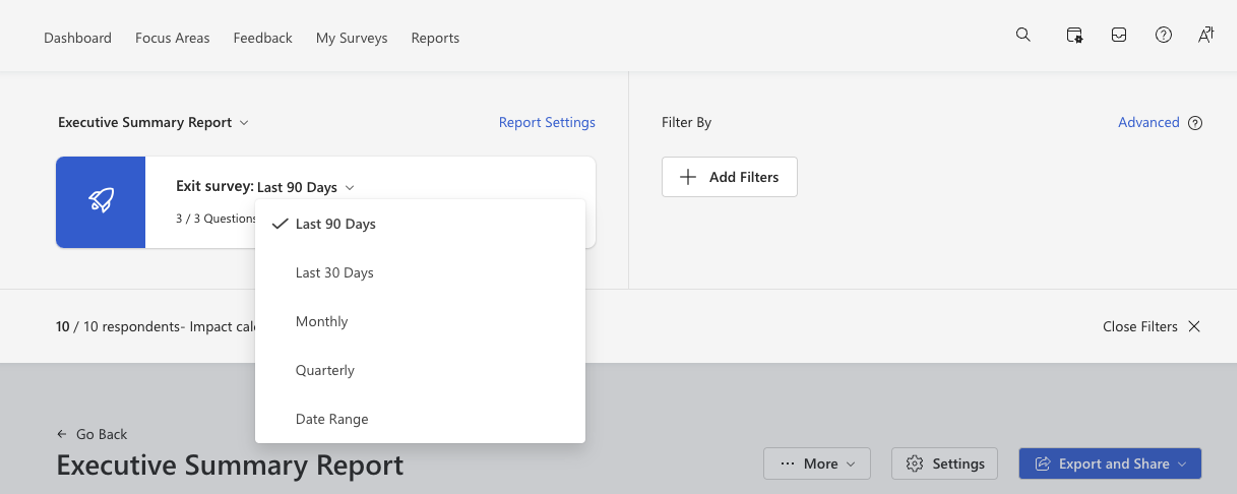
Other date ranges
Aside from the default range, users can select the following preset date ranges or enter custom dates when viewing ELC survey results. Use these tables to determine the date ranges that are used to display scores for each timeframe.
Last 30 days
| Data point | "Surveyed on" date displayed | Score date range |
|---|---|---|
| Most recent | 30 days before today's date | 30 days before today - today |
| Second most recent | 60 days before today's date | 60 days before today - 30 days before today |
| Third most recent | 90 days before today's date | 90 days before today - 60 days before today |
| Fourth most recent | 120 days before today's date | 120 days before today - 90 days before today |
Monthly
Note
Monthly views are based on calendar year, not fiscal year.
| Data point | "Surveyed on" date displayed | Score date range |
|---|---|---|
| Most recent | First day of current month | First day of current month - today |
| Second most recent | First day of previous month | First day of previous month - end of previous month |
| Third most recent | First day of previous month | First day of previous month - end of previous month |
| Fourth most recent | First day of previous month | First day of previous month - end of previous month |
Quarterly
Note
Quarterly views are based on calendar year, not fiscal year.
| Data point | "Surveyed on" date displayed | Score date range |
|---|---|---|
| Most recent | First day of current quarter | First day of current quarter - today |
| Second most recent | First day of previous quarter | First day of previous quarter - end of previous quarter |
| Third most recent | First day of previous quarter | First day of previous quarter - end of previous quarter |
| Fourth most recent | First day of previous quarter | First day of previous quarter - end of previous quarter |
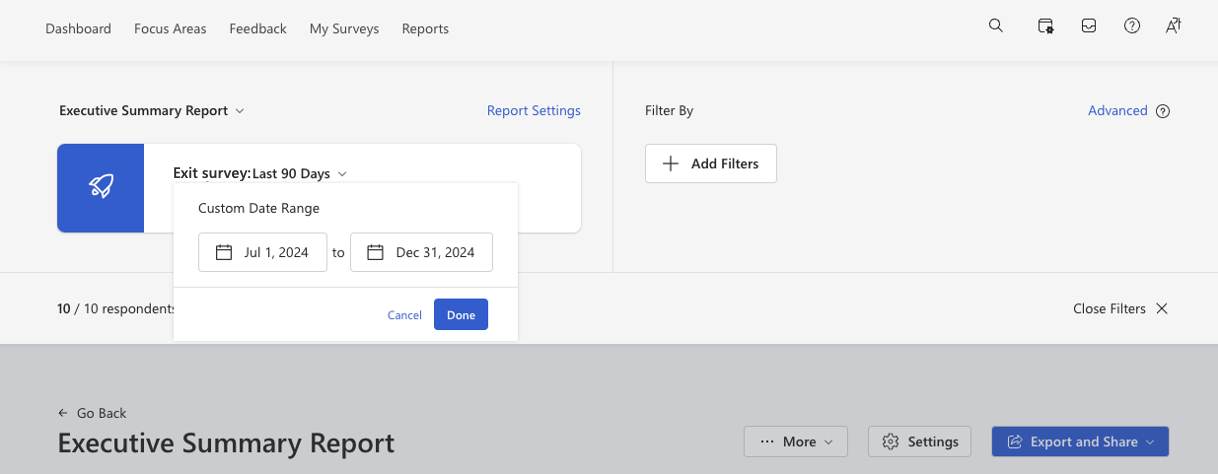
Custom date range
| Data point | "Surveyed on" date displayed | Score date range |
|---|---|---|
| Most recent | Start date of custom date range | Start date - end date of custom date range |
| Second most recent | Custom range days before start date | Custom range days before start date - custom range start date |
| Third most recent | Custom range days x2 before start date | Custom range days x2 before start date - custom range days before start date |
| Fourth most recent | Custom range days x3 before start date | Custom range days x3 before start date - custom range days x2 before start date |
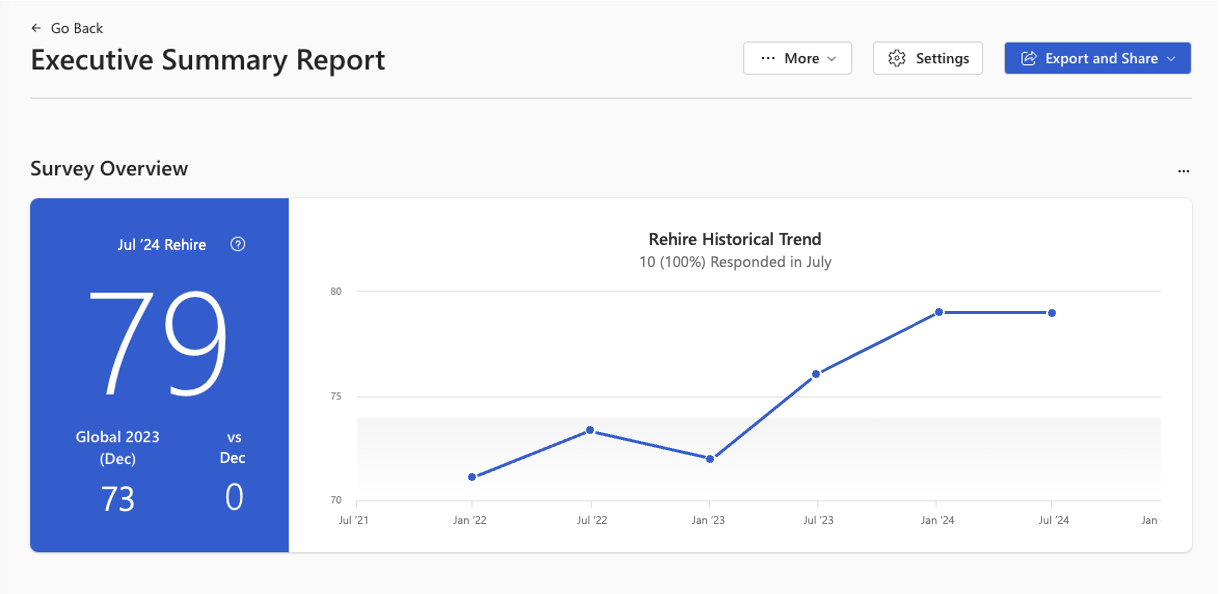
Example
A user at Contoso wants to view Exit survey scores over time based on six month periods. In this case, they need to select a custom date range because no preset date ranges show scores based on six month timeframes. They select July 1, 2024 through December 31, 2024.
The previous data points on the trend line show six month scores going back in time, displayed in the table.
| Data point | "Surveyed on" date displayed | Score date range |
|---|---|---|
| Most recent | Jul 1, 2024 | Jul 1, 2024 - Dec 31, 2024 |
| Second most recent | Dec 31, 2023 | Dec 31, 2023 - Jul 1, 2024 |
| Third most recent | Jul 1, 2023 | Jul 1, 2023 - Dec 31, 2023 |
| Fourth most recent | Dec 31, 2022 | Dec 31, 2022 - Jul 1, 2023 |
| Fifth most recent | Jul 1, 2022 | Jul 1, 2022 - Dec 31, 2022 |
| Sixth most recent | Dec 31, 2021 | Dec 31, 2021 - Jul 1, 2022 |
And the trend line in the Executive Summary Report shows data points going back in time by six month increments.