Use the Viva Glint Multiple Choice Question Report
The Microsoft Viva Glint Multiple Choice Question Report allows users to see a breakdown of responses to questions that offer multiple response selections. This report provides visibility into response patterns to multiple choice questions across the organization and Viva Glint Administrators can add filters and sections for more specific insights.
Access the Multiple Choice Question Report
Note
The Multiple Choice Question Report only appears as an option in Reports when:
- The selected survey has at least one multiple choice or multi-select question.
- The selected survey's Reporting setup for a role has the Multiple Choice Question Report selected in the Report Template Access section.
To access the Multiple Choice Question Report:
Go to Reports and select a survey from the Surveys list on the left.
Select the Multiple Choice Question Report tile from the Your Reports section.

By default, the report displays two sections based on primary and secondary hierarchy selections in General Settings.
Filter and edit the Multiple Choice Question Report
Like other reports in Viva Glint, users can add filters to and edit sections in the Multiple Choice Question Report.
To add a filter:
- Select the filter pane at the top of the report.
- Select + Add Filters.
- Choose attributes and values in the People list or select responses and comment topics/sentiment in the Question Responses list.
To edit sections:
- Select the ellipsis in the top right of a section.
- In the dropdown menu that appears select Edit.
- In the Edit Section pane that appears:
- Use the Demographic breakdown option to select a different attribute for the section.
- Use the Multiple choice question option to select a different multiple choice question (if available).
- Use the Show option to select Respondent or Respondent and Changes to view the current survey's response breakdown or current with difference since the last survey's response breakdown.
To delete a section:
- Select the ellipsis in the top right of a section.
- In the dropdown menu that appears select Remove.
Percentage breakdowns in the Multiple Choice Question Report
The Multiple Choice Question Report shows a table for each question, listing the response options from the question vertically. Horizontally, each response shows a percentage broken down by the attribute selected for the section. When questions allow users to make multiple selections, the total percentage for each attribute for a multi-select question is greater than 100%. To full the full response option text for an option, hover over the partial response in the table.
Color-coding
Response percentages are color-coded from light gray (0%) to dark blue (100%) according to the color breakdown guide at the bottom of each section.
Example
If a Contoso admin wants to view two manager teams' response breakdowns side by side, they select each manager team to filter to Manager A and Manager B's teams:
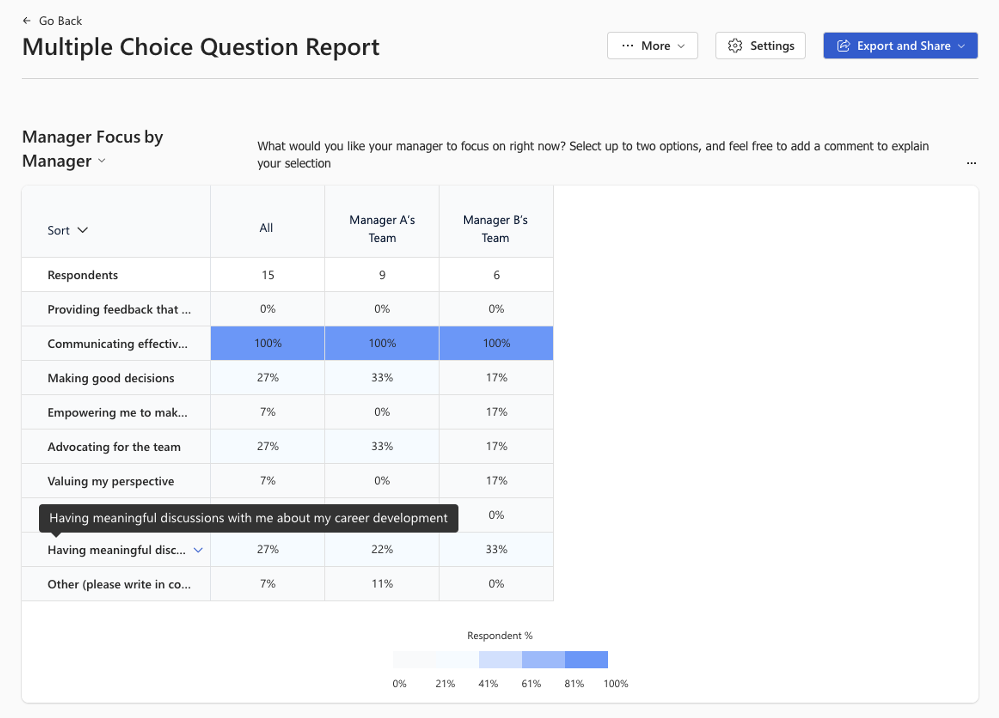
For both teams, all users selected "Communicating effectively" as a focus area for their manager. Because users could select up to two options, the total percentages across all responses for the question don't equal 100%. Admins can use this report to find out where the highest percentage of users selected manager focus areas that are most important for their managers to work on.