Instrument your .NET application in Visual Studio (C#, C++, Visual Basic, F#)
With the release of Visual Studio 2022 version 17.5, you can use the new dynamic Instrumentation tool. This tool shows the exact number of times your functions are called and is faster than the previous version of the Instrumentation tool. This tool supports .NET Core instrumentation without needing PDBs. Starting in Visual Studio 2022 version 17.6 Preview 2, the tool also supports C/C++.
The tool is similar to the CPU Usage tool except it's based on wall clock time instead of CPU utilization. This means blocked time such as time spent waiting for locks will show up in the instrumentation trace, unlike the CPU Usage tool. For additional information on learning to use the Instrumentation tool effectively, see Instrumentation Overview and Improving Visual Studio performance with the new Instrumentation Tool.
Instrument your application
Select Alt+F2 (or Debug > Performance Profiler) to open the performance profiler in Visual Studio.
Select the Instrumentation check box.

If you enable the Start with collection paused option before starting the profiler, data won't be collected until you select the Record button in the diagnostic session view.
Note
If the tool isn't available for selection, clear every other tool's check box because some tools need to run alone. To learn more about running tools together, see Using multiple profiler tools simultaneously.
If the tool still isn't available, check that your project meets the preceding requirements. Make sure your project is in Release mode to capture the most accurate data.
Select the Start button to run the tool.
Select the items in your program to instrument.

Starting in Visual Studio 2022 version 17.11 Preview 1, the profiler persists the selected items for the next profiling run.
Select OK.
After the tool starts running, go through the scenario you want to profile in your app. Then select Stop collection or close the app to see your data.
Analyze the Instrumentation report
Your profiling data appears in Visual Studio.

The Instrumentation data view shows you a list of functions ordered by longest running, with the longest running function at the top under Top Functions. The Hot Path section shows you the call stack for the functions that are using the most time. These lists can help guide you to functions where performance bottlenecks are happening.
Click on a function that you're interested in, and you see a more detailed view.
The available data is similar to the CPU Usage tool, except that it's based on wall clock time and call counts instead of CPU utilization.
Analyze insights
If any insights show up in the Top Insights section, use the provided link to get more information about the issue identified. For more information, see CPU insights, but be aware that information for the Instrumentation tool is specific to wall clock time and not CPU utilization.
In addition, if you are using Copilot, use the Ask Copilot button to open the Copilot chat window, and Copilot will provide suggestions based on an examination of your code and any identified issues.
Analyze instrumentation detailed reports
To analyze the Instrumentation report, click Open details, or click one of the top functions to open the Functions view.
The report provides different views of the diagnostic data:
- Caller/callee
- Call tree
- Modules
- Functions
- Flame graph
In all views except Caller/callee, the diagnostic report is sorted by Total [unit, %], from highest to lowest. Change the sort order or sort column by selecting the column headers. You can double-click on a function that you are interested in, and you will see the source for the function as well as highlighting that shows where time is spent in that function. The table shows columns with data such as the time spent in the function, including called functions (Total), and a second column that shows the time spent in a function, excluding called functions (Self).
This data can help you assess whether the function itself is a performance bottleneck. Determine how much data the method is displaying to see if third-party code or runtime libraries are the reason for your endpoints being slow or resource-consumption heavy.
For more information on using the Flame graph, see Identify hot paths with Flame Graph.
Instrumentation call tree
To view the call tree, select the parent node in the report. By default, the Instrumentation page opens to the Caller/Callee view. In the Current View dropdown, select Call Tree. The call tree view can help you quickly identify performance bottlenecks.
You can click the Expand Hot Path and Show Hot Path buttons to see the function calls that use the most wall clock time in the call tree view.
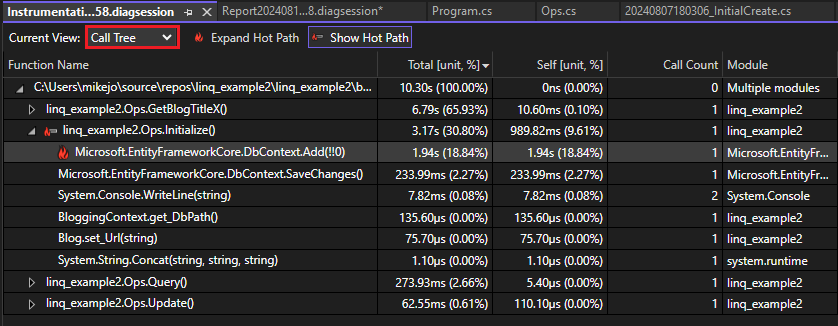
Here is more information on the column values:
Total indicates how much time was spent in the function and any functions called by it. High Total values point to the functions that are consuming the most clock time.
Self indicates how much time was spent in the function body, excluding the time spent in any functions that were called by it. High Self values may indicate a performance bottleneck within the function itself.
Call Count indicates the number of times a function is called.
Module The name of the module containing the function.