Inspect variables in the Visual Studio debugger
Features that allow you to inspect variables are some of the most useful features of the debugger, and there are different ways to do it. Often, when you try to debug an issue, you are attempting to find out whether variables are storing the values that you expect them to have in a particular app state.
In this article, you'll learn how to inspect variables using the debugger in Visual Studio. The Visual Studio debugger provides several convenient ways to view variable values while debugging, including the following:
- Variable inspection windows (Autos, Locals, and Watch windows)
- Data tips in the code editor
- Inline return values
- Visualizers for large strings or complex .NET objects
These features are only available while debugging. To learn how to start a debugging session, see Start debugging and enter break mode.
Note
If this is the first time that you've tried to debug code, you might want to read Debugging for absolute beginners and Debugging techniques and tools before going through this article.
Inspect variables in the Autos and Locals windows
The Autos and Locals windows show variable values while you are debugging. The windows are only available during a debugging session. The Autos window shows variables used around the current statement where the debugger is paused. The Locals window shows variables defined in the local scope, which is usually the current function or method.
To open the Autos window, while debugging, select Debug > Windows > Autos, or press Ctrl+Alt+V > A.
The Autos window is available for C#, Visual Basic, C++, and Python code, but not for JavaScript or F#.
To open the Locals window, while debugging, select Debug > Windows > Locals, or press Alt+4.
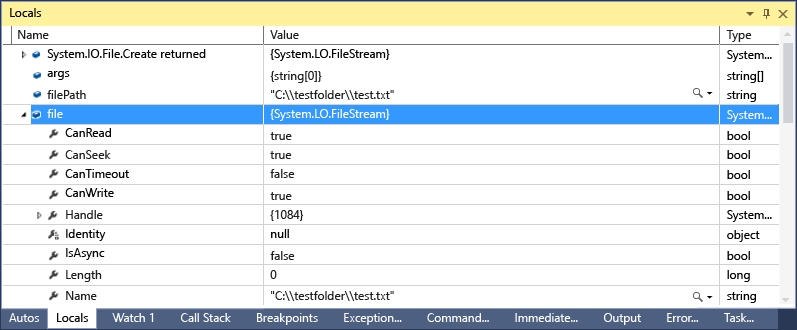
Arrays and objects show in the Autos and Locals windows as tree controls. Select the arrow to the left of a variable name to expand the view to show fields and properties. Here is an example of a System.IO.FileStream object in the Locals window:
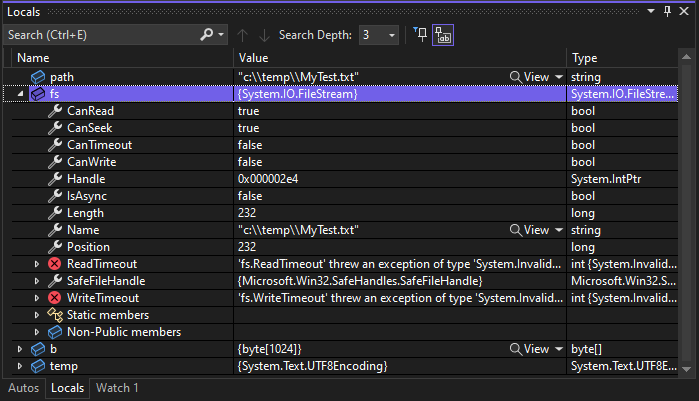
A red value in the Locals or Autos window means the value has changed since the last evaluation. The change could be from a previous debugging session, or because you have changed the value in the window.
The default numeric format in debugger windows is decimal. To change it to hexadecimal, right-click in the Locals or Autos window and select Hexadecimal Display. This change affects all debugger windows.
Edit variable values in the Autos or Locals window
To edit the values of most variables in the Autos or Locals windows, double-click the value and enter the new value.
You can enter an expression for a value, for example a + b. The debugger accepts most valid language expressions.
In native C++ code, you might have to qualify the context of a variable name. For more information, see Context operator (C++).
Caution
Make sure you understand the consequences before you change values and expressions. Some possible issues are:
Evaluating some expressions can change the value of a variable or otherwise affect the state of your program. For example, evaluating
var1 = ++var2changes the value of bothvar1andvar2. These expressions are said to have side effects. Side effects can cause unexpected results if you are not aware of them.Editing floating-point values can result in minor inaccuracies because of decimal-to-binary conversion of fractional components. Even a seemingly harmless edit can result in changes to some of the bits in the floating-point variable.
Search in the Autos or Locals window
You can search for keywords in the Name, Value, and Type columns of the Autos or Locals window using the search bar above each window. Hit ENTER or select one of the arrows to execute a search. To cancel an ongoing search, select the "x" icon in the search bar.
Use the left and right arrows (Shift+F3 and F3, respectively) to navigate between found matches.


To make your search more or less thorough, use the Search Deeper dropdown list at the top of the Autos or Locals window to select how many levels deep you want to search into nested objects.
Pin properties in the Autos or Locals window
Note
This feature is supported for .NET Core 3.0 or higher.
You can quickly inspect objects by their properties in the Autos and Locals windows with the Pinnable Properties tool. To use this tool, hover over a property and select the pin icon that appears or right-click and select the Pin Member as Favorite option in the resulting context menu. This bubbles up that property to the top of the object's property list, and the property name and value are displayed in the Value column. To unpin a property, select the pin icon again or select the Unpin Member as Favorite option in the context menu.

You can also toggle property names and filter out non-pinned properties when viewing the object's property list in the Autos or Locals windows. You can access each option by selecting the buttons in the toolbar above the Autos or Locals windows.


Change the context for the Autos or Locals window
You can use the Debug Location toolbar to select a desired function, thread, or process, which changes the context for the Autos and Locals windows.
To enable the Debug Location toolbar, click in an empty part of the toolbar area and select Debug Location from the dropdown list, or select View > Toolbars > Debug Location.
Set a breakpoint and start debugging. When the breakpoint is hit, execution pauses and you can see the location in the Debug Location toolbar.


Language differences in the Autos window (C#, C++, Visual Basic, Python)
Different code languages display different variables in the Autos window.
In C# and Visual Basic, the Autos window displays any variable used on the current or preceding line. For example, in C# or Visual Basic code, declare the following four variables:
     public static void Main()
     {
        int a, b, c, d;
        a = 1;
        b = 2;
        c = 3;
        d = 4;
     }
Set a breakpoint on the line
c = 3;, and start the debugger. When execution pauses, the Autos window will display: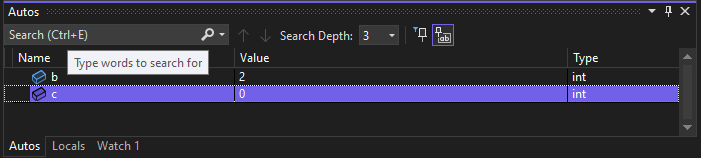
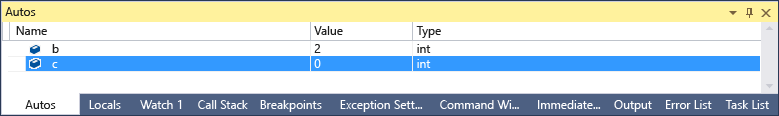
The value of
cis 0, because the linec = 3has not yet been executed.In C++, the Autos window displays the variables used in at least three lines before the current line where execution is paused. For example, in C++ code, declare six variables:
     void main() {
         int a, b, c, d, e, f;
         a = 1;
         b = 2;
         c = 3;
         d = 4;
         e = 5;
         f = 6;
     }
Set a breakpoint on the line
e = 5;and run the debugger. When execution stops, the Autos window will display: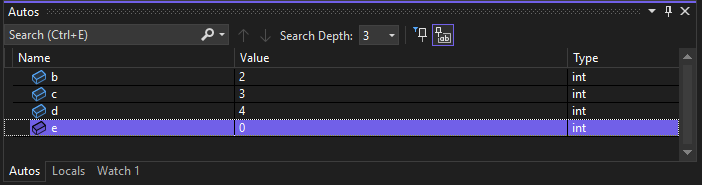
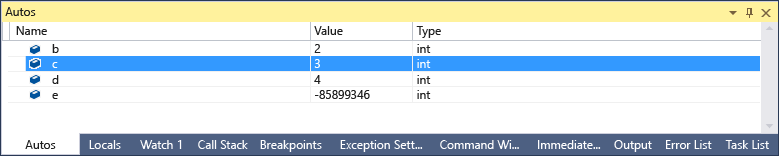
The variable
eis uninitialized, because the linee = 5has not yet been executed.
View data tips
Often, when debugging, you want a quick way to check property values on objects in the code editor, and the data tips are a good way to do it. For detailed information on using data tips, see View data values in data tips.
While paused in the debugger, hover over an object with the mouse and you see its value, or its default property value.


If the variable has properties, you can expand the object to see all its properties.
Set a watch on variables
You can use a Watch window to specify a variable (or an expression) that you want to keep an eye on. For detailed information, see Set a Watch using the Watch and QuickWatch Windows.
While debugging, right-click an object and choose Add Watch.


In this example, you have a watch set on the object, and you can see its value change as you move through the debugger. Unlike the other variable windows, the Watch windows always show the variables that you are watching (they're grayed out when out of scope).
View return values of method calls
In .NET and C++ code, you can examine return values in the Autos window when you step over or out of a method call, which can be useful when the return value is not stored in a local variable. A method could be used as a parameter, or as the return value of another method.
Starting in Visual Studio 2022 version 17.12 Preview 3, you can also view return values of method calls inline and not just in the Autos window.

With Copilot enabled, you can also get targeted assistance related to the inline return value by using the Ask Copilot button that appears in the data tip for the return value.

View return values in the Autos windows
In the following example, this C# code adds the return values of two functions:
static void Main(string[] args)
{
    int a, b, c, d;
    a = 1;
    b = 2;
    c = 3;
    d = 4;
    int x = sumVars(a, b) + subtractVars(c, d);
}

private static int sumVars(int i, int j)
{
    return i + j;
}

private static int subtractVars(int i, int j)
{
    return j - i;
}
To see the return values of the sumVars() and subtractVars() method calls in the Autos window:
Set a breakpoint on the
int x = sumVars(a, b) + subtractVars(c, d);line.Start debugging, and when execution pauses at the breakpoint, select Step Over or press F10. You should see the following return values in the Autos window:


Inspect variables in a visualizer
While you are debugging in Visual Studio, you can view large strings or complex objects with built-in visualizers that make the data easier to inspect. For example:
- The string visualizer shows text, XML, HTML, and JSON strings that are too long for a data tip or debugger window. It can also help you identify malformed strings. For more information, see View strings in a string visualizer.
- The DataSet and IEnumerable visualizers show .NET collection objects in a tabular visualizer. For more information, see Tabular visualizers in Visual Studio) objects.
The visualizers appear in the Autos windows and other debugger windows.
Note
If you need to inspect XAML or WPF UI elements in a visualizer, see or Inspect XAML properties while debugging or How to use the WPF tree visualizer.
To open a visualizer, you must be paused during debugging. Hover over a variable that has a supported visualizer value, and select the magnifying glass icon ![]() .
.


Get AI assistance
If you have Copilot, you can get AI assistance while you're looking at variables in the Autos or Locals windows, or in data tips. Right-click on a variable and use the Ask Copilot  button. In this scenario, Copilot already knows the context for your question, so you don't need to provide context yourself in chat. For more information, see Debug with Copilot.