Troubleshoot Apps failing to start using Process Monitor
This article describes how to install the Process Monitor tool to troubleshoot the issue in which Modern, Inbox, and Microsoft Store Apps fail to start.
Download the Process Monitor tool. Once the Process Monitor tool is downloaded locally, extract the files.
Capture events
In order to capture a Process Monitor trace, run it with elevated permissions (run as administrator).
Note
Make sure you're running the version of Process Monitor that matches the platform (Procmon.exe for x86 systems, Procmon64.exe for X64 systems, and Procmon64a.exe for ARM).
Once started, reset any previously saved filters to default to ensure that no potential events are filtered out by the previously set filters. If it's the first time you run Process Monitor or if there are no filters set, you can start recording without the pop-up window.

By default, the recording should start automatically. However, you can make sure it's running by selecting the following icon:
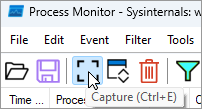
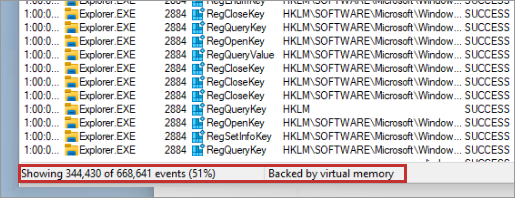
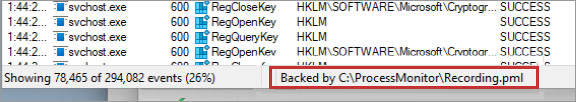
Alternatively, you can start the recording by pressing Ctrl + E or by selecting Capture Events from the File menu. You see the events recorded in the status bar as follows:

Alternatively, if a graphical user interface (GUI) isn't an option or the system is accessible remotely only with console access, you can trace the issue using Windows PowerShell or a command prompt. For example:
C:\ProcessMonitor>procmon64.exe -accepteula -backingfile C:\ProcessMonitor\Recording.pml -quiet -minimized
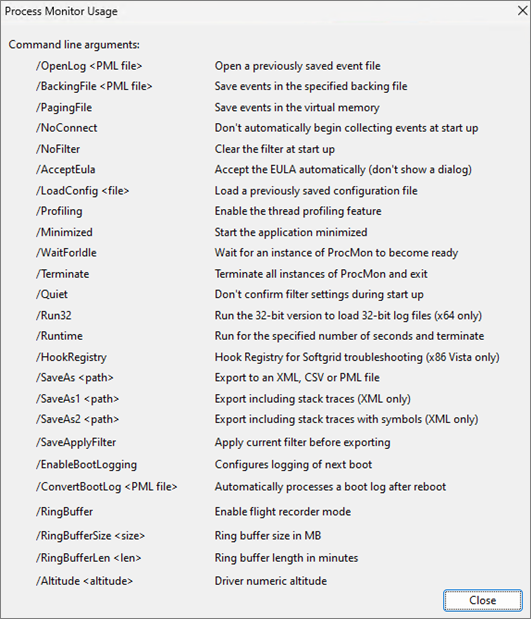
Other options are available, including filtering and setting the maximum file size. For more information, see Process Monitor.
To terminate and save the trace, you can use the following command:
C:\ProcessMonitor>procmon64.exe -terminate -quiet
Additionally, you can remotely run Process Monitor using PowerShell or the PsExec tool. For example:
C:\PSTools>psexec.exe -sd \\<Computer Name> C:\ProcessMonitor\procmon64.exe -accepteula -backingfile C:\ProcessMonitor\Recording.pml -quiet -minimized
To stop the recording, you can use the following command:
C:\PSTools>psexec.exe -sd \\<Computer Name> C:\ProcessMonitor\procmon64.exe -terminate -quiet
Store and save events
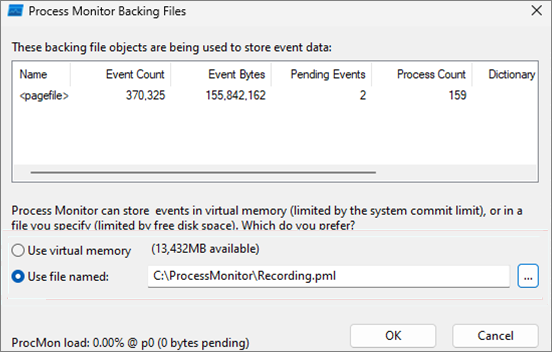
There are several methods available to store and save the events. You can select Backing files from the File menu. Then, you can see two methods to store events:
- Use virtual memory
- Use file named
Use virtual memory
This method uses the system's memory to store the file until it gets saved by the user manually.
Note
Running the Process Monitor for too long, backed by virtual memory, might cause the Process Monitor to consume all the available system virtual memory, which could lead to the system stopping responding.
If you start recording as Backed by virtual memory, you need to save the recording prior to exiting Process Monitor.
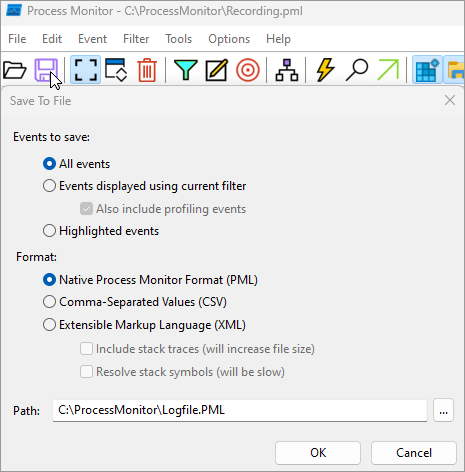
Make sure you select All events and the format is set as Native Process Monitor Format (PML). If the recording doesn't contain all the events, you only have the displayed or highlighted events available for analysis, which might be insufficient.
Backed by file
This method uses a file to store the recording and doesn't require saving the file manually before exiting Process Monitor.
Note
If the maximum file size isn't defined, running the Process Monitor for too long, backed by a file, might cause the Process Monitor to consume all the available system disk space, which could lead to the system stopping responding.
Once the Process Monitor is set and the recording is started, you need to reproduce the problem.
Troubleshooting example
Take this issue as an example; you have the Calculator application that isn't working. First, start the Process Monitor recording with any of the methods described above. Then reproduce the problem by trying to start the application. Once the issue is reproduced, stop the Process Monitor recording and save the data.
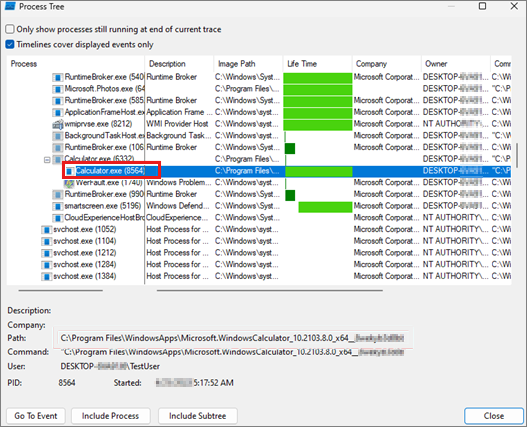
To analyze the recorded Process Monitor trace, open it with Process Monitor. Select Process Tree under Tools on the Menu to see if your application starts during the recording.
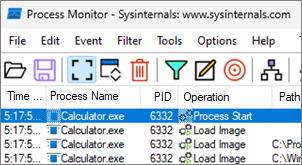
Select the Calculator process:
To focus on the process, right-click the application name and select Add process to Include filter.
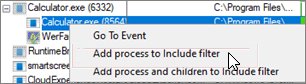
Similarly, you can add a filter manually for your process ID.

Exit the Process Tree view or select OK on the Process Monitor Filter window to see the filtered captured lines containing your process. In this example, the Calculator.exe process is starting.
Then go towards the end of the process capture, and look for a group of the Thread Exit events right before the Process Exit event.
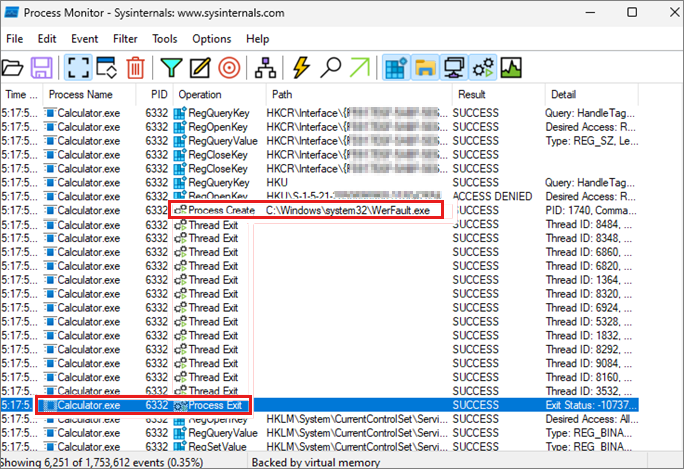
You can also see the Process Create event for WerFault.exe. At that point, the application has already reached an unrecoverable condition and has called the default error handler.
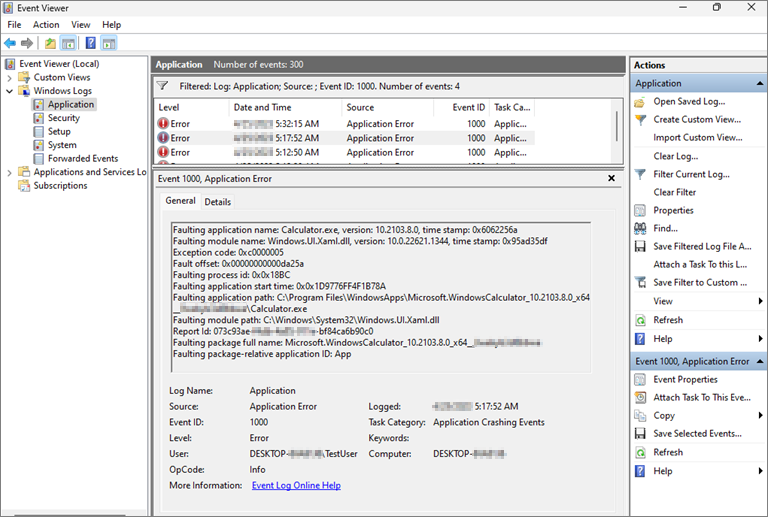
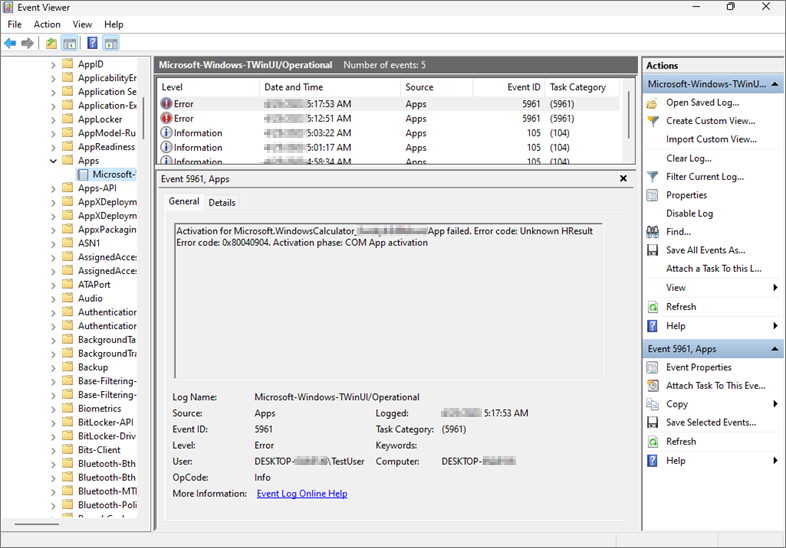
You should also notice that some event logs related to application crashes are recorded as well.
You can start from this line to see if you can spot any Access Denied Results events.

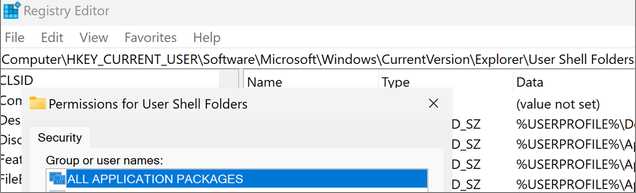
In this situation, you should check the permissions of the following registry key against those from a working machine to see if there are some differences.
\HKEY_CURRENT_USER\Software\Microsoft\Windows\CurrentVersion\Explorer\User Shell Folders
In this example, ALL APPLICATION PACKAGES is missing "read" permissions from User Shell Folders.
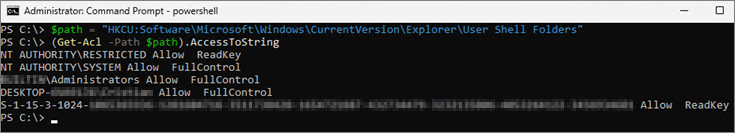
This operation can also be done by using PowerShell or a command prompt.
For the working system:
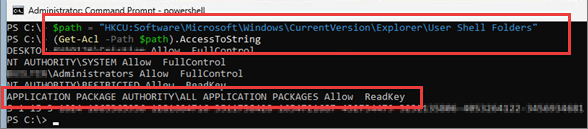
For the nonworking system:
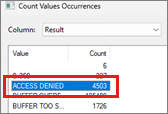
If you don't spot any nearby permission issues that could be suspicious, you can always check the entire trace for any suspect permission blocks. First, remove the filter for the Calculator process by selecting Reset Filter under the Filter menu. Then, select the Count Occurrences option from the Tools menu. You can choose the result Result from the drop-down menu, then select Count.
Once the filtering is done, you can double-click the "Access Denied" line to view the filtered events:

If you work through the list, not all "Access Denied" results cause the code to fail.
Generally, anything asking for "All Access" is often refused, so you can exclude them from your investigations. You can do it automatically by filtering the events containing Desired Access: All Access as follows:

In this example, the result looks like the following:


Adding the appropriate permission for "All Application Packages" resolves both issues at the same time for both applications.
Sometimes it isn't possible to work out what permission change is stopping the application from starting. Process Monitor only captures some parts of the process activities.
If many machines are affected by the same problem, work out the troubleshooting by starting from a new, freshly installed machine and slowly adding your policies until the application fails to start again.
If only one machine is affected, recover or reset the machine. If only one user is affected, recreate the user's profile.