Note
Access to this page requires authorization. You can try signing in or changing directories.
Access to this page requires authorization. You can try changing directories.
This article helps you diagnose intermittent connection time-outs that are reported between availability group replicas.
Symptoms and effects of intermittent availability group replica connection time-outs
Querying primary and secondary replicas returns different results
Read-only workloads that query secondary replicas might query stale data. If intermittent replica connection time-outs occur, changes to data on the primary replica database aren't yet reflected in the secondary database when you query the same data. For more information, see the Data latency on secondary replica section.
Diagnostics report availability group not synchronized
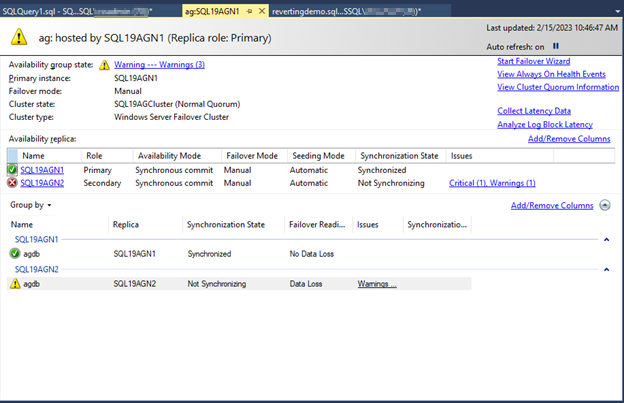
The Always On dashboard in SQL Server Management Studio might report an unhealthy availability group that has replicas to be in a Not Synchronizing state. You might also observe the Always On dashboard report replicas to be in the Not synchronizing state.
When you review the SQL Server error logs of those replicas, you might observe messages such as the following that indicate that there was a connection time-out between the replicas in the availability group:
Error log from the primary replica
2023-02-15 07:10:55.500 spid43s Always On availability groups connection with secondary database terminated for primary database 'agdb' on the availability replica 'SQL19AGN2' with Replica ID: {<replicaid>}. This is an informational message only. No user action is required.
Error log from the secondary replica
2023-02-15 07:11:03.100 spid31s A connection time-out has occurred on a previously established connection to availability replica 'SQL19AGN1' with id [<replicaid>]. Either a networking or a firewall issue exists or the availability replica has transitioned to the resolving role.

2023-02-15 07:11:03.100 spid31s Always On Availability Groups connection with primary database terminated for secondary database 'agdb' on the availability replica 'SQL19AGN1' with Replica ID: {<replicaid>}. This is an informational message only. No user action is required.
Intermittent connection problems can affect a secondary replica's failover readiness
If you configure the availability group for automatic failover, and the synchronous commit failover partner is intermittently disconnected from the primary, automatic failover might be unsuccessful.
You can query sys.dm_hadr_database_replia_cluster_states to determine whether the availability group database is failover-ready at that moment. Here's an example of the results if the mirroring endpoint was stopped on the secondary replica:
SELECT drcs.database_name, drcs.is_failover_ready, ar.replica_server_name, ars.role_desc, ars.connected_state_desc,
ars.last_connect_error_description, ars.last_connect_error_number, ar.endpoint_url
FROM sys.dm_hadr_availability_replica_states ars JOIN sys.availability_replicas ar ON ars.replica_id=ar.replica_id
JOIN sys.dm_hadr_database_replica_cluster_states drcs ON ar.replica_id=drcs.replica_id
WHERE ars.role_desc='SECONDARY'
Automatic failover might not bring the availability group online in the primary role on the failover partner computer if failover coincides with a replica connection time-out.
What do the connection time-out errors indicate?
The default value is 10 seconds for the availability group replica setting, SESSION_TIMEOUT. This setting is configured for each replica. It determines how long the replica waits to receive a response from its partner replica before it reports a connection time-out. If a replica gets no response from the partner replica, it reports a connection time-out in the Microsoft SQL Server error log and the Windows Application log. The replica that reports the time-out immediately tries to reconnect, and will continue to try every five seconds.
Typically, the connection time-out is detected and reported by only one replica. However, the connection time-out might be reported by both replicas at the same time. There are different versions of this message, depending on whether the connection time-out occurred by using a previously established connection or a new connection:
Message 35206 A connection timeout has occurred on a previously established connection to availability replica '<replicaname>' with id [<replicaid>]. Either a networking or a firewall issue exists or the availability replica has transitioned to the resolving role.

Message 35201 A connection timeout has occurred while attempting to establish a connection to availability replica '<replicaname>' with id [<replicaid>]. Either a networking or firewall issue exists, or the endpoint address provided for the replica is not the database mirroring endpoint of the host server instance.
The partner replica might not detect a time-out. If it does, it might report message 35201 or 35206. If it doesn't, it reports a connection loss to each of the availability group databases:
Message 35267 Always On Availability Groups connection with primary/secondary database terminated for primary/secondary database '<databasename>' on the availability replica '<replicaname>' with Replica ID: {<replicaid>}. This is an informational message only. No user action is required.
Here's an example of what SQL Server reports to the error log: If you stop the mirroring endpoint on the primary replica, the secondary replica detects a connection time-out, and messages 35206 and 35267 are reported in the secondary replica error log:
2023-02-15 07:11:03.100 spid31s A connection timeout has occurred on a previously established connection to availability replica 'SQL19AGN1' with id [<replicaid>]. Either a networking or a firewall issue exists or the availability replica has transitioned to the resolving role.

2023-02-15 07:11:03.100 spid31s Always On Availability Groups connection with primary database terminated for secondary database 'agdb' on the availability replica 'SQL19AGN1' with Replica ID:[<replicaid>]. This is an informational message only. No user action is required.
In this example, the primary replica didn't detect any connection time-out because it could still communicate with the secondary, and it reported message 35267 for each availability group database (in this example, there's only one database, 'agdb'):
2023-02-15 07:10:55.500 spid43s Always On Availability Groups connection with secondary database terminated for primary database 'agdb' on the availability replica 'SQL19AGN2' with Replica ID: {<replicaid>}. This is an informational message only. No user action is required.
Causes of replica connection time-outs
Application issue
SQL Server might be busy for any of several reasons, and doesn't service the mirroring endpoint connection within the availability group SESSION_TIMEOUT period. This causes the connection time-out. Some of these reasons are:
SQL Server experiences 100 percent CPU utilization. This means that SQL Server or some other application is driving CPU for seconds at a time.
SQL Server experiences non-yielding scheduler events. SQL Server threads are responsible for yielding the scheduler (CPU) to other threads to complete their work if a thread doesn't yield in a timely fashion.
SQL Server experiences worker thread exhaustion, out-of-memory problems, or application problems that affect its ability to service the mirroring endpoint connection.
Network issue
This requires that you collect network trace logs on the primary and secondary replicas when the error is triggered. To do this, you can examine network latency and dropped packets.
How to diagnose replica connection time-outs
For the problem of application issues that prevent SQL Server from servicing the connection with the partner replica, this section explains how to analyze the SQL Server logs. These tips can help you to identify the root cause of the replica connection time-outs. This section ends with more advanced guidance about how to collect network traces when the connection time-outs occur so that you can check the network status.
Assess timing and location of replica connection time-outs
Review the history, the frequency, and trends of the connection time-outs. Using the messages that you find in the SQL Server error log is a great way to do this. Where are the connection time-outs reported? Are they consistently reported on the primary or the secondary replica? When did the errors occur? Did they occur in a certain week of the month, day of the week, or time of day? Does other scheduled maintenance or batch processing correspond to the times at which the connection time-outs are observed? This assessment can help you scope and correlate the connection time-outs to identify the root cause.
Review the AlwaysOn_health extended event session
The AlwaysOn_health extended event session was enhanced to include the ucs_connection_setup event, which is triggered when a replica is establishing a connection with its partner replica. This can be helpful when troubleshooting connection time-out issues.
Note
The ucs_connection_setup extended event was added to the latest SQL Server cumulative updates. You must be running the latest cumulative updates to observe this extended event.
Query Always On Distributed Management Views (DMVs)
You can query Always On DMVs for more information about the replica's connected state. This query reports only the connected state and any errors that are associated with the connection time-out at the time that the issues occur. If the connection issues are intermittent, the query might not capture the disconnected state easily.
SELECT ar.replica_server_name, ars.role_desc, ars.connected_state_desc,
ars.last_connect_error_description, ars.last_connect_error_number, ar.endpoint_url
FROM sys.dm_hadr_availability_replica_states ars JOIN sys.availability_replicas ar ON ars.replica_id=ar.replica_id
The following example shows a sustained disconnected state because the mirroring endpoint on the primary replica was stopped. By querying the primary replica, the Always On DMV can report on the primary and all secondary replicas (the endpoint is disabled on the primary replica).
By querying the secondary replica, the Always On DMVs reports on only the secondary replica.
Review the Always On extended event session
Connect to each replica by using SQL Server Management Studio (SSMS) Object Explorer, and open the
AlwaysOn_healthextended event files.In SSMS, go to File > Open, and then select Merge Extended Event Files.
Select the Add button.
In the File Open dialog box, navigate to the files in the SQL Server \LOG directory.
Press Control, and then select the files whose name begins with 'AlwaysOn_healthxxx.xel'.
Select Open, and then select OK.
You should see a new tabbed window in SSMS that shows the AlwaysOn events.
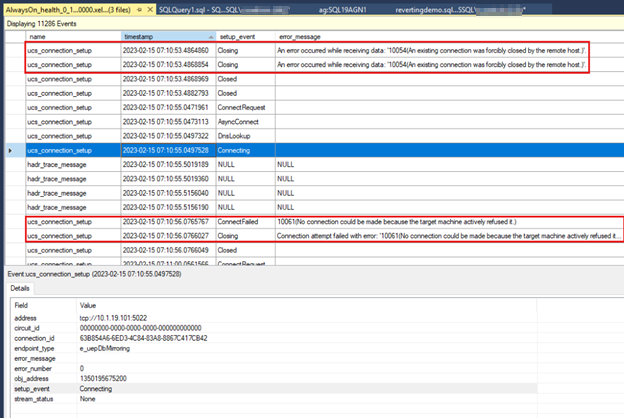
The following screenshot shows the
AlwaysOn_healthdata from the secondary replica. The first outlined box shows the connection loss after the endpoint on the primary replica is stopped. The second outlined box shows the connection failure that occurs the next time that the secondary replica tries to connect to the primary replica.
Check to see if non-yielding events are causing connection time-outs
One of the most common reasons that an availability replica can't service the partner replica connection is a non-yielding scheduler. For more information about non-yielding schedulers, see Troubleshooting SQL Server Scheduling and Yielding.
SQL Server tracks non-yielding scheduler events that are as short as 5 to 10 seconds. It reports these events in the TrackingNonYieldingScheduler data point in the sp_server_diagnostics query_processing component output.
To check for non-yielding events that might cause replica connection time-outs, follow these steps:
Create a SQL Agent job that records
sp_server_diagnosticsevery five seconds.Schedule this job on the server that doesn't report the connection time-out. That is, if Server A replica reports the replica connection time-out in its error log, set up the SQL Agent job on the partner replica, Server B. Alternatively, if you are seeing connection time-outs on both replicas, create the job on both replicas.
Run the following batch file to create a job that runs
sp_server_diagnosticsevery five seconds, appends the output to a text file, and then starts the job. The command in the following example,sp_server_diagnostics 5executes every five seconds. So, there is no need to schedule this job to run every five seconds, just start the job and it will run until stopped, every five seconds:USE [msdb] GO DECLARE @ReturnCode INT SELECT @ReturnCode = 0 DECLARE @jobId BINARY(16) EXEC @ReturnCode = msdb.dbo.sp_add_job @job_name=N'Run sp_server_diagnostics', @owner_login_name=N'sa', @job_id = @jobId OUTPUT /****** Object: Step [Run SP_SERVER_DIAGNOSTICS] Script Date: 2/15/2023 4:20:41 PM ******/ EXEC @ReturnCode = msdb.dbo.sp_add_jobstep @job_id=@jobId, @step_name=N'Run SP_SERVER_DIAGNOSTICS', @subsystem=N'TSQL', @command=N'sp_server_diagnostics 5', @database_name=N'master', @output_file_name=N'D:\cases\2423\sp_server_diagnostics_output.out', @flags=2 EXEC @ReturnCode = msdb.dbo.sp_add_jobserver @job_id = @jobId, @server_name = N'(local)' EXEC sp_start_job 'Run sp_server_diagnostics'Note
In these commands, change
@output_file_nameto a valid path and provide a file name.
Analyze the results
When a connection time-out is reported, note the timestamp of the time-out event that's shown in the SQL Server error log. For the replicas in the following example, SQL19AGN1 was reporting the replica connection time-outs. Therefore, a SQL Agent job was created on SQL19AGN2, the partner replica. Then, a connection time-out was reported in the SQL19AGN1 error log at 07:24:31.
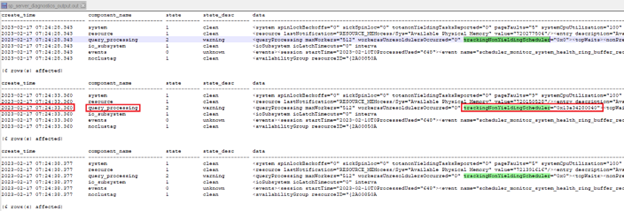
Next, the output from the SQL Agent job that runs sp_server_diagnostics is checked at around the reported time, specifically reviewing the TrackingNonYieldingScheduler data point in the query_processing component output. The output reports that a non-yielding scheduler was tracked (as a non-zero hexadecimal value) on server SQL19AGN2 (at 07:24:33) around the time that the replica connection time-out was reported on SQL19AGN1 (at 07:24:31).
Note
The following sp_server_diagnostics output is concatenated to show both the create_time (timestamp) and query_processing TrackingNonYieldingScheduler results.
Investigate a non-yielding scheduler event
If you verified from the earlier diagnosis steps that a non-yielding event caused the replica connection time-out:
Identify the workloads that are running in SQL Server at the time that the non-yielding events are run.
Similar to the replica connection time-outs, look for trends in these events during the month, day, or week that they occur.
Collect performance monitor tracing on the system on which the non-yielding event was detected.
Collect key performance counters for system resources, including Processor::% Processor Time, Memory::Available MBytes, Logical Disk::Avg Disk Queue Length, and Logical Disk::Avg Disk sec/Transfer.
If it's necessary, open a SQL Server support incident for further assistance in finding root cause for these non-yielding events. Share the logs that you've collected for further analysis.
Advanced Data Collection: Collect network trace during connection time-out
If the previous diagnosis of the SQL Server application didn't yield a root cause, you should check the network. Successful analysis of the network requires that you collect a network trace that covers the time of the connection time-out.
The following procedure starts a Windows netsh network tracing on the replicas on which the connection time-outs are reported in the SQL Server error logs. A Windows scheduled event task is triggered when one of the SQL Server connection errors is recorded in the Application log. The scheduled task runs a command to stop the netsh network trace so that the key network trace data isn't overwritten. These steps also assume a path of *F:* for the batch and tracing logs. Adjust this path to your environment.
Start a network trace, as shown in the following code snippet, on the two replicas on which the connection time-outs occur:
netsh trace start capture=yes persistent=yes overwrite=yes maxsize=500 tracefile=f:\trace.etlCreate Windows scheduled tasks that stop the
netshtrace on events 35206 or 35267. You can create these tasks at an administrative command line:schtasks /Create /tn Event35206Task /tr F:\stoptrace.bat /SC ONEVENT /EC Application /MO *[System/EventID=35206] /f /RL HIGHEST schtasks /Create /tn Event35267Task /tr F:\stoptrace.bat /SC ONEVENT /EC Application /MO *[System/EventID=35267] /f /RL HIGHESTAfter the event occurs and the network traces are stopped and captured, you can delete the
ONEVENTtasks:PS C:\Users\sqladmin> Schtasks /Delete /tn Event35206Task /F PS C:\Users\sqladmin> Schtasks /Delete /tn Event35267Task /F
Analysis of the network trace is outside the scope of this troubleshooter. If you can't interpret the network trace, contact the Microsoft SQL Server Support team and provide the trace along with other requested log files for root cause analysis.
What else can I do to mitigate the connection time-outs?
The default availability group, SESSION_TIMEOUT, is configured for 10 seconds. You might be able to mitigate the connection time-outs by adjusting the availability group replica SESSION_TIMEOUT property. This setting is per replica. Adjust it for the primary and each affected secondary replica. Here's an example of the syntax. The default SESSION_TIMEOUT value is 10. Therefore, you could use 15 as the next value.
ALTER AVAILABILITY GROUP ag
MODIFY REPLICA ON 'SQL19AGN1' WITH (SESSION_TIMEOUT = 15);


